> ## Documentation Index
> Fetch the complete documentation index at: https://docs.runconverge.com/llms.txt
> Use this file to discover all available pages before exploring further.

# Overview report

> Build your own custom executive dashboard

export const LoomVideo = ({src}) => {
  const containerStyle = {
    position: 'relative',
    paddingBottom: '60.13363028953229%',
    height: 0
  };
  const iframeStyle = {
    position: 'absolute',
    top: 0,
    left: 0,
    width: '100%',
    height: '100%'
  };
  return <div style={containerStyle}>
      <iframe src={src} frameBorder="0" allow="fullscreen; webkitallowfullscreen; mozallowfullscreen" style={iframeStyle} title="Loom Embed"></iframe>
    </div>;
};

export const CloudinaryVideo = ({src, controls = true, autoplay = false, loop = false, muted = true, poster = null}) => {
  return <video controls={controls} autoPlay={autoplay} loop={loop} className="w-full shadow-lg" src={src} muted={muted} poster={poster} playsinline></video>;
};

export const OutboundLink = ({linkText, linkTarget}) => {
  return <a target="_blank" href={linkTarget}> {linkText} 
    <div className="inline h-3 w-3 fill-gray-500 dark:fill-gray-100 text-gray-500 dark:text-gray-300 ml-1 mr-1">
      <svg className="inline w-2.5 h-2.5 bg-gray-500 dark:bg-gray-300" style={{
    maskImage: `url('https://mintlify.b-cdn.net/v6.5.1/solid/up-right-from-square.svg')`,
    maskRepeat: "no-repeat",
    maskPosition: "center center"
  }}></svg> 
    </div>
    </a>;
};

export const Icon = ({name}) => {
  return <div className="h-4 w-4 fill-gray-800 dark:fill-gray-100 text-gray-800 dark:text-gray-100 inline-block align-middle">
            <svg className="w-4 h-4 bg-gray-800 dark:bg-gray-100" style={{
    maskImage: `url('https://mintlify.b-cdn.net/v6.5.1/solid/${name}.svg')`,
    maskRepeat: "no-repeat",
    maskPosition: "center center"
  }} />
        </div>;
};

export const IconText = ({name, text, iconSource = "mintlify", iconLocation = "before", iconType = "solid"}) => {
  const sourceUrl = iconSource === 'local' ? `url('/images/icons/${name}.svg')` : `url('https://mintlify.b-cdn.net/v6.5.1/${iconType}/${name}.svg')`;
  return <>
            <div className="inline-block pl-2">
                {iconLocation === 'before' && <div className="h-3.5 w-3.5 fill-gray-800 dark:fill-gray-100 text-gray-800 dark:text-gray-100 inline-block align-middle mr-2">
                        <svg className="w-4 h-4 bg-gray-800 dark:bg-gray-100 " style={{
    maskImage: sourceUrl,
    maskRepeat: "no-repeat",
    maskPosition: "center center"
  }} />
                    </div>}
                <span className="inline-block align-middle font-semibold fill-gray-800 dark:fill-gray-100 text-gray-800 dark:text-gray-100 pl-1 pr-2">{text}</span>
                {iconLocation === 'after' && <div className="h-3.5 w-3.5 fill-gray-800 dark:fill-gray-100 text-gray-800 dark:text-gray-100 inline-block align-middle mr-2">
                        <svg className="w-4 h-4 bg-gray-800 dark:bg-gray-100 pr-3" style={{
    maskImage: sourceUrl,
    maskRepeat: "no-repeat",
    maskPosition: "center center"
  }} />
                    </div>}
            </div>
        </>;
};

## Where to find the Overview Report

You can access the Overview Report by clicking on <IconText text="Overview" iconSource="local" name="piggybank" /> in the **Analytics** section.

## Video Demo

<CloudinaryVideo src="https://res.cloudinary.com/drv76uky1/video/upload/v1744198370/Overview_Report_xw9cql.mp4" muted={false} />

<Info> Check the <OutboundLink linkText="Metrics Dictionary" linkTarget="https://docs.runconverge.com/attribution/metrics" /> to understand the precise definition of all of these metrics </Info>

## Customizing the Overview

You can customize the overview by clicking on <IconText text="Edit overview" name="line-columns" iconType="solid" /> in the top right corner.

<Accordion title="Add or remove metrics" icon="circle-plus">
  You can choose to hide an entire section (e.g. all Facebook Metrics) or specific metrics within a section.

  **Hide an entire section**

  1. Click on <IconText name="line-columns" text="Edit overview" iconType="solid" /> in the top right corner of the Overview dashboard
  2. Click on the <Icon name="eye" />-icon next to the category you want to hide so it appears in a disabled state.
  3. Click **Save**.

  **Hide a metric within a section**

  1. Click on <IconText name="line-columns" text="Edit overview" iconType="solid" /> in the top right corner of the Overview dashboard
  2. Click on the <Icon name="pencil" />-icon next to the category to which you want to remove or add a card.
  3. In the list of metrics of the section, click on the <Icon name="eye" />-icon next to the metric you want to hide so it appears in a disabled state.
  4. Click **Save**.
</Accordion>

<Accordion title="Change the order of the metrics" icon="sort">
  You can change the order of an entire section (e.g., all Facebook Metrics) or specific metrics within a section.

  **Re-order an entire section**

  1. Click on <IconText name="line-columns" text="Edit overview" iconType="solid" /> in the top right corner of the Overview dashboard
  2. Drag and re-order the section by grabbing onto the <Icon name="grip-vertical" />-icon and moving it above or under other sections.
  3. Click **Save**.

  **Re-order metrics within a section**

  1. Click on <IconText name="line-columns" text="Edit overview" iconType="solid" /> in the top right corner of the Overview dashboard
  2. Click on the <Icon name="pencil" />-icon next to the category in which you want to reorganize cards.
  3. Drag and re-order the metric by grabbing onto the <Icon name="grip-vertical" />-icon and moving it above or under other sections.
  4. Click **Save**.
</Accordion>

## Overview Report on Mobile

Converge doesn't have a mobile app, but you can add the Overview Report to your home screen to check your main acquisition KPIs on the go.

### Add to Home Screen on iOS

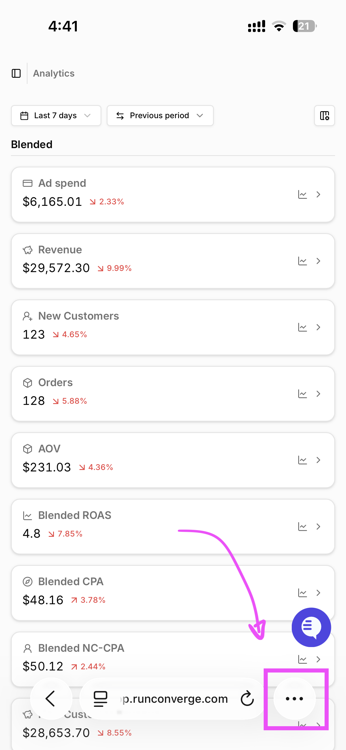
1. Navigate to [app.runconverge.com](https://app.runconverge.com) in Safari

2. Tap the Share button at the bottom of the screen

   <img src="https://mintcdn.com/converge/R3s0s-q33mUtIu2T/images/attribution/mobile-overview-install-0.png?fit=max&auto=format&n=R3s0s-q33mUtIu2T&q=85&s=7c59262a7bcc416e618ad2d78dfe2db5" alt="iOS share menu" style={{ maxWidth: '250px' }} width="346" height="750" data-path="images/attribution/mobile-overview-install-0.png" />

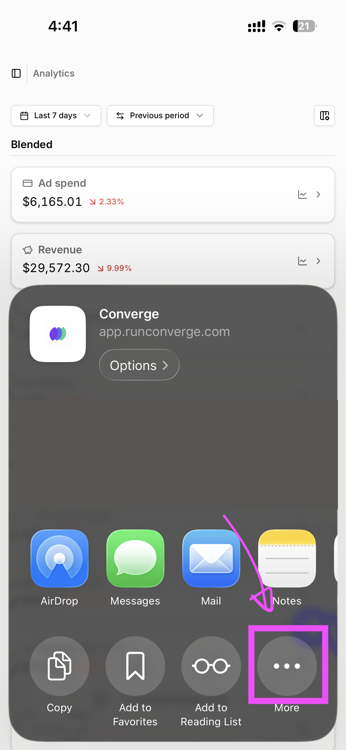
3. Scroll down and tap **Add to Home Screen**
   <img src="https://mintcdn.com/converge/R3s0s-q33mUtIu2T/images/attribution/mobile-overview-install-1.png?fit=max&auto=format&n=R3s0s-q33mUtIu2T&q=85&s=504381d27580c8bf522c6c8c620c89c2" alt="iOS share options" style={{ maxWidth: '250px' }} width="346" height="750" data-path="images/attribution/mobile-overview-install-1.png" />

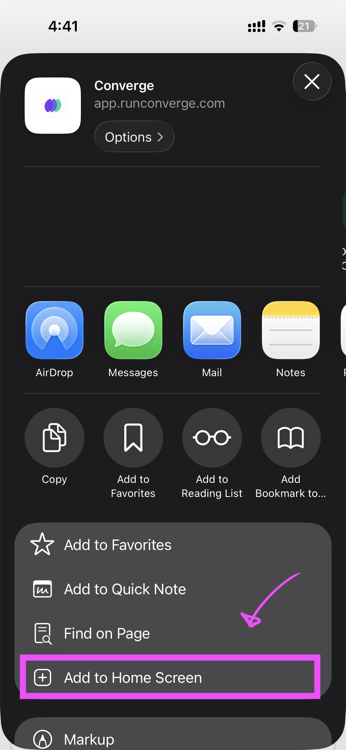
4. Tap **Add** in the top right corner
   <img src="https://mintcdn.com/converge/R3s0s-q33mUtIu2T/images/attribution/mobile-overview-install-2.png?fit=max&auto=format&n=R3s0s-q33mUtIu2T&q=85&s=3b65b49d73b5dda1bbc6d3ab4e6c094d" alt="Add to Home Screen confirmation" style={{ maxWidth: '250px' }} width="346" height="750" data-path="images/attribution/mobile-overview-install-2.png" />

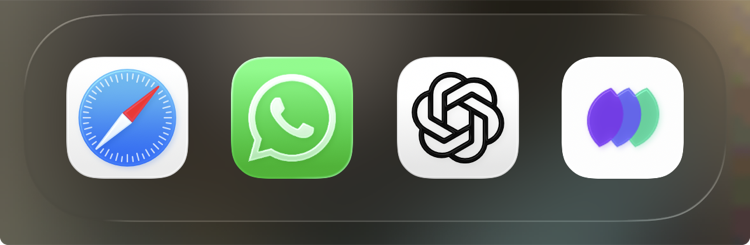
5. The Converge icon will now appear on your home screen.
   <img src="https://mintcdn.com/converge/R3s0s-q33mUtIu2T/images/attribution/mobile-overview-1.png?fit=max&auto=format&n=R3s0s-q33mUtIu2T&q=85&s=df2192923f6d74e8dd25505e98a7594b" alt="Converge app icon on iOS home screen" style={{ maxWidth: '280px' }} width="750" height="245" data-path="images/attribution/mobile-overview-1.png" />

### Add to Home Screen on Android

1. Navigate to [app.runconverge.com](https://app.runconverge.com) in Chrome
2. Tap the three-dot menu in the top right corner
3. Tap **Add to Home screen**
4. Enter a name (or keep the default) and tap **Add**
5. Tap **Add** again in the confirmation dialog
6. The Converge icon will now appear on your home screen

***

## FAQ

<Accordion title="Why are my Shopify Sales and Converge Revenues misaligned?">
  The Converge Revenues card and the Shopify Sales card show slightly different metrics.

  Specifically, Converge includes gift card revenue in your total revenue number, and it doesn't subtract refunds.
  Shopify, however, shows a sales number with refunds already subtracted and without gift card revenue.

  **In short**:

  * **Shopify Sales** = `Gross Revenue` - `Refunds` - `Gift card revenue`
  * **Converge Revenue** = `Gross Revenue`

  If you want to make a comparison between Converge and Shopify, please follow this <OutboundLink linkText="guide" linkTarget="/guides/compare-shopify-converge" />.
</Accordion>
