> ## Documentation Index
> Fetch the complete documentation index at: https://docs.runconverge.com/llms.txt
> Use this file to discover all available pages before exploring further.
# Analytics
> How to analyze your data in Converge
export const CloudinaryVideo = ({src, controls = true, autoplay = false, loop = false, muted = true, poster = null}) => {
return ;
};
export const InPlatformIcon = () => {
return ;
};
export const ConvergeIcon = () => {
return ;
};
## Introduction
Converge offers multiple reporting options to analyze data from your **Event sources** and **Marketing sources**.
Insights and Dashboards require a separate license. Contact your Converge rep for access.
***
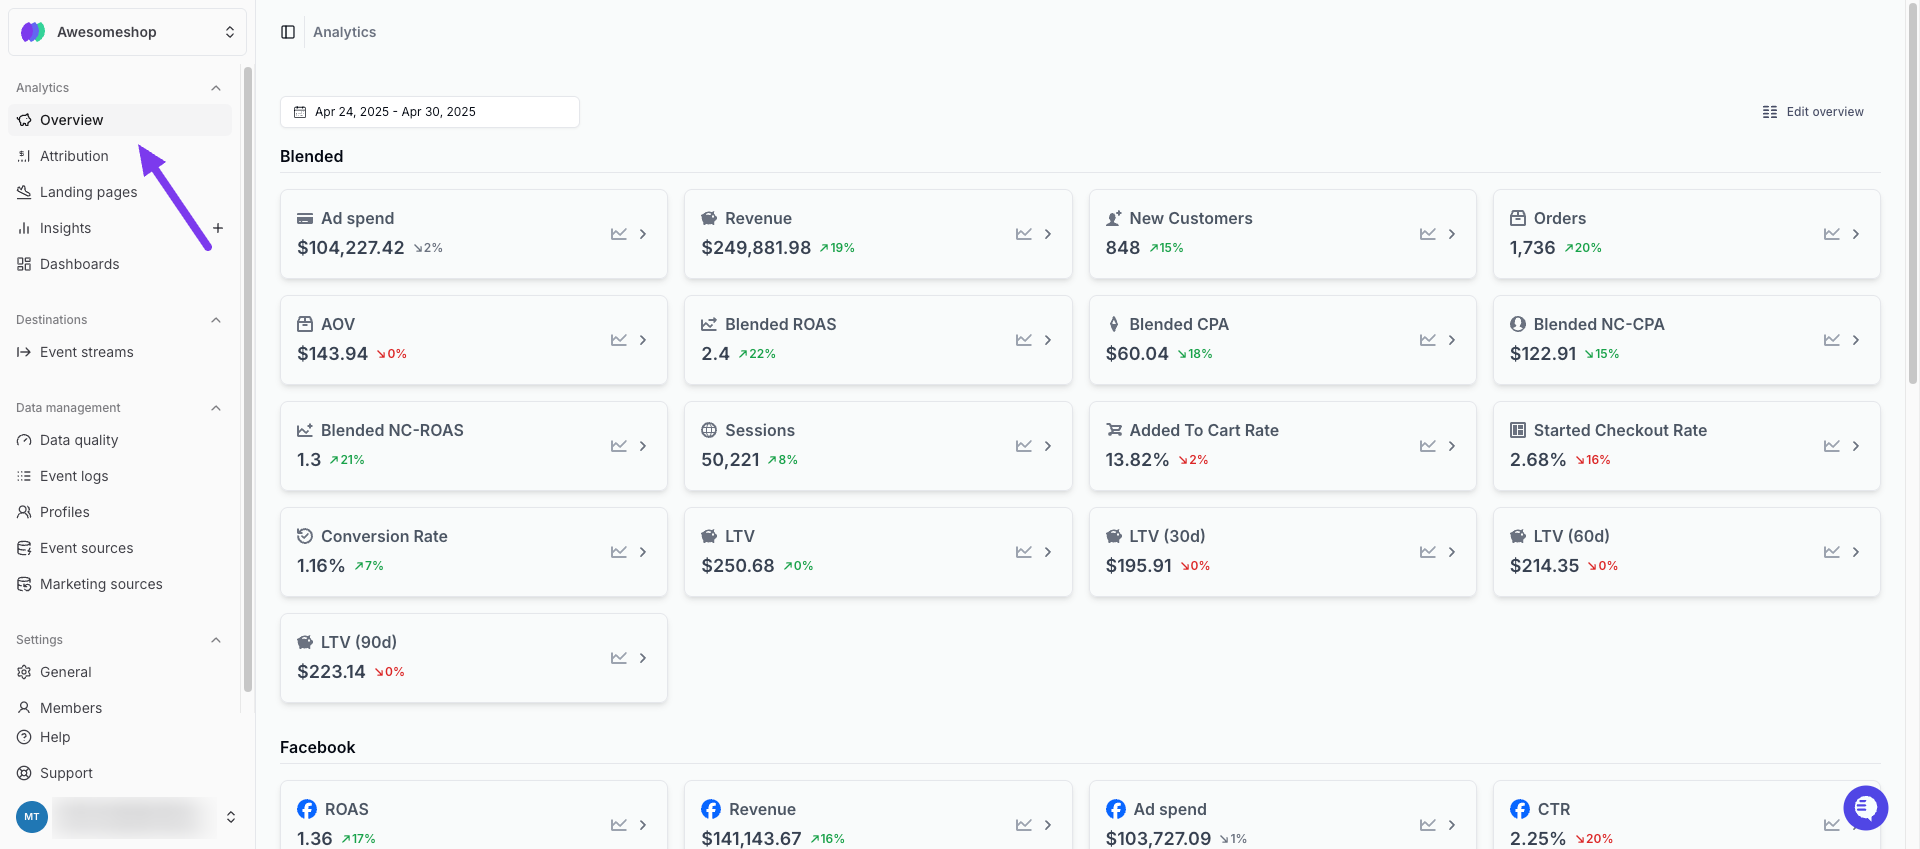
## Overview report
The Overview Report gives you a quick look at your **key metrics**.
It includes:
* **Blended**: Metrics based on all your connected sources.
* **Platforms**: In-platform metrics from each marketing source.
You can customize the report to show only the metrics and sections you care about.
 ***
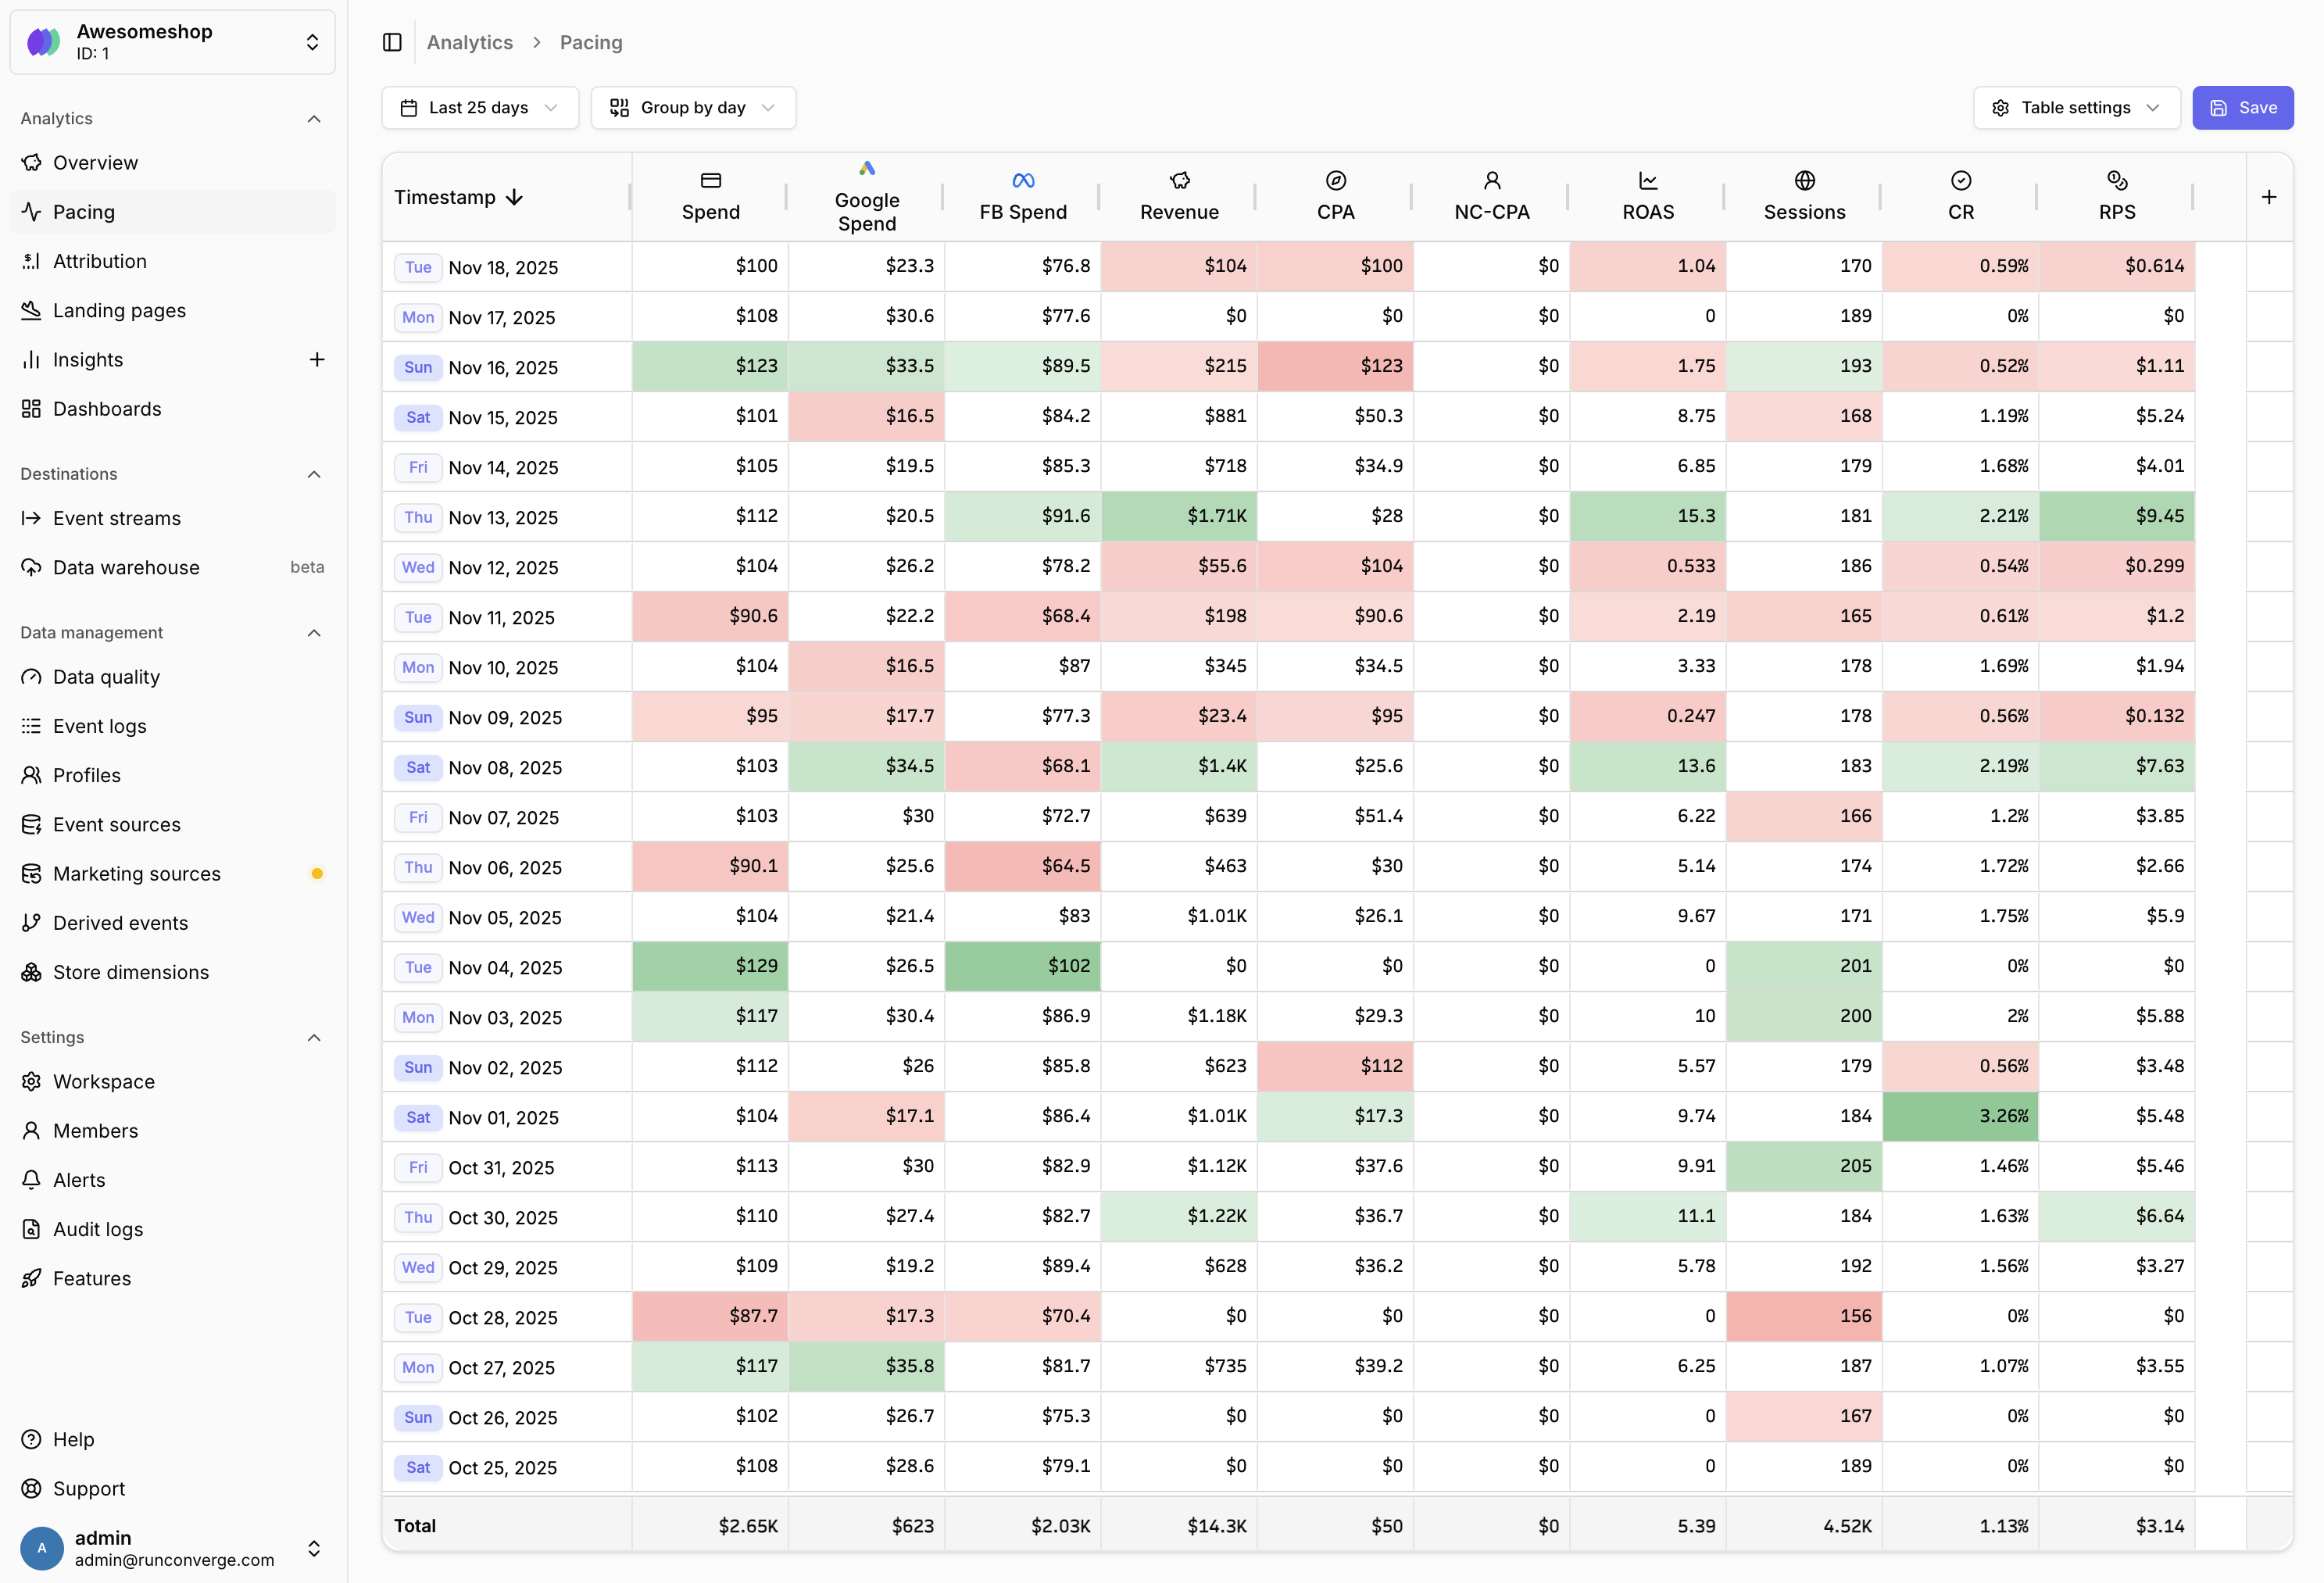
## Pacing Sheet
Many merchants use separate daily spreadsheets to track their core metrics, but these spreadsheets are not real-time and are prone to data entry errors.
The Pacing Sheet replaces your daily spreadsheet with **up-to-date, accurate data** directly from Converge, helping you to spot **trends and anomalies**.
It includes:
* **Blended**: Metrics based on all your connected sources.
* **Platforms**: In-platform metrics from each marketing source.
You can customize the table to show only the metrics and sections you care about.
***
## Pacing Sheet
Many merchants use separate daily spreadsheets to track their core metrics, but these spreadsheets are not real-time and are prone to data entry errors.
The Pacing Sheet replaces your daily spreadsheet with **up-to-date, accurate data** directly from Converge, helping you to spot **trends and anomalies**.
It includes:
* **Blended**: Metrics based on all your connected sources.
* **Platforms**: In-platform metrics from each marketing source.
You can customize the table to show only the metrics and sections you care about.
 ***
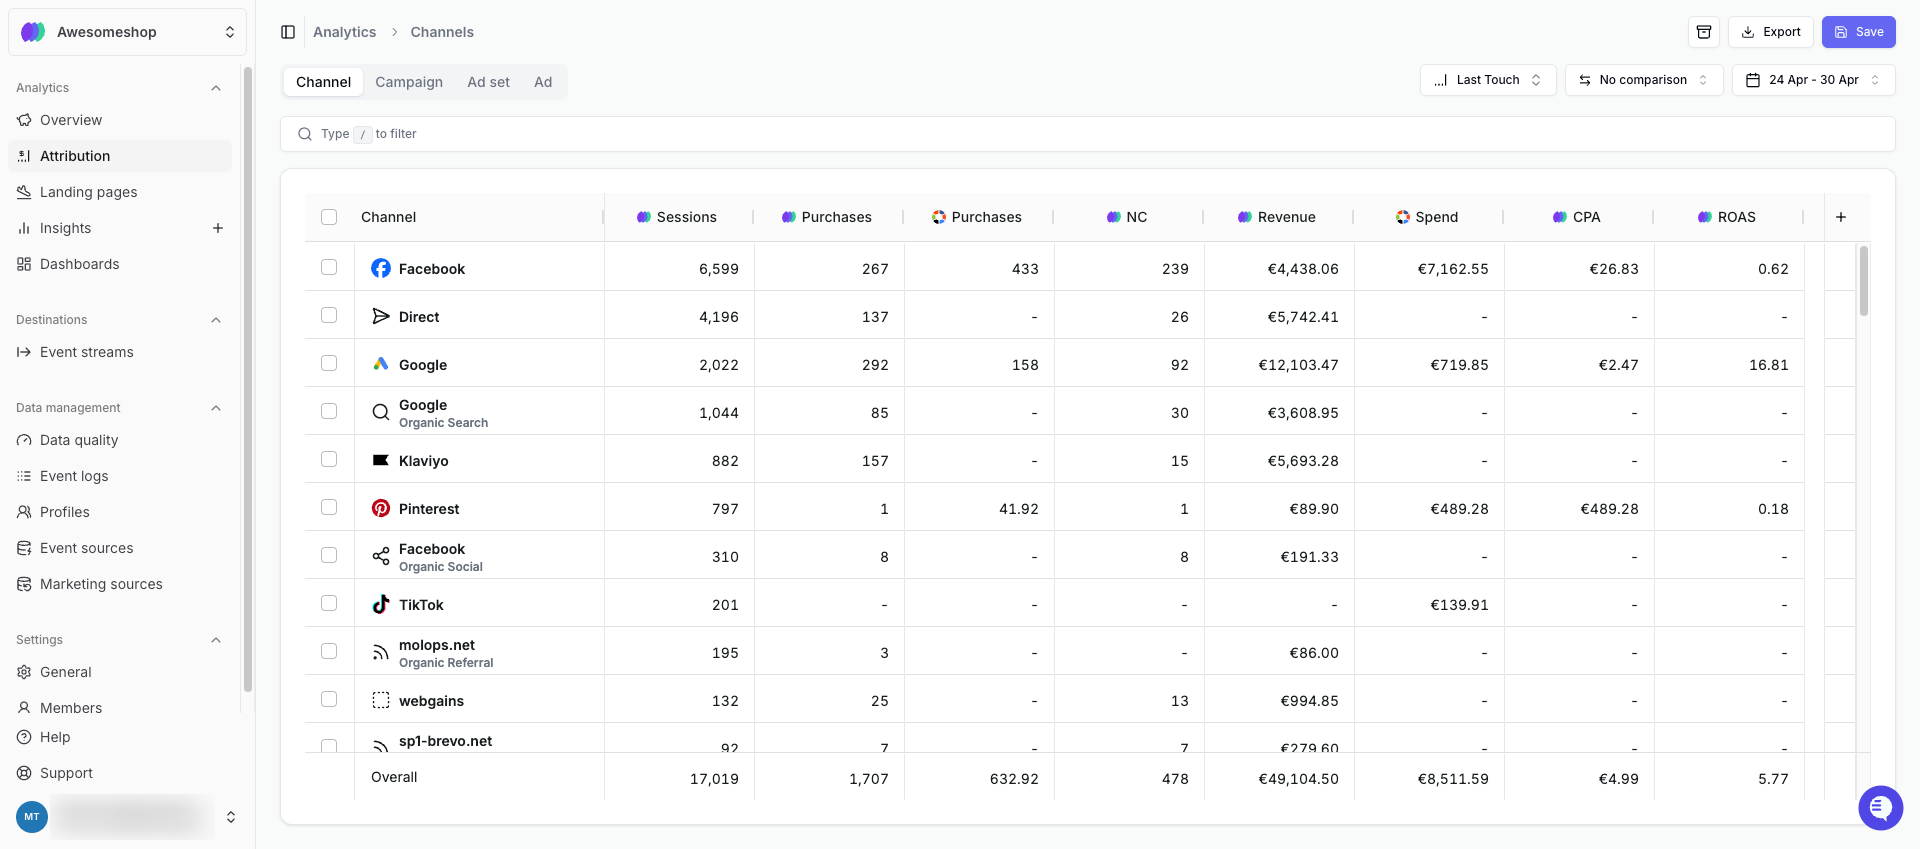
## Attribution report
The Attribution Report shows how your **Channels**, **Campaigns**, **Ad sets**, or **Ads** are performing—and what’s driving your business.
Metrics are attributed using:
* **First-party attribution**: Converge attribution based on the model you select and your tracking parameters. Identified with this icon: .
* **In-platform attribution**: Metrics from the ad platforms themselves. Identified with this icon: .
You can adjust your **first-party attribution** with the attribution models described [here](/attribution/models).
***
## Attribution report
The Attribution Report shows how your **Channels**, **Campaigns**, **Ad sets**, or **Ads** are performing—and what’s driving your business.
Metrics are attributed using:
* **First-party attribution**: Converge attribution based on the model you select and your tracking parameters. Identified with this icon: .
* **In-platform attribution**: Metrics from the ad platforms themselves. Identified with this icon: .
You can adjust your **first-party attribution** with the attribution models described [here](/attribution/models).
 ***
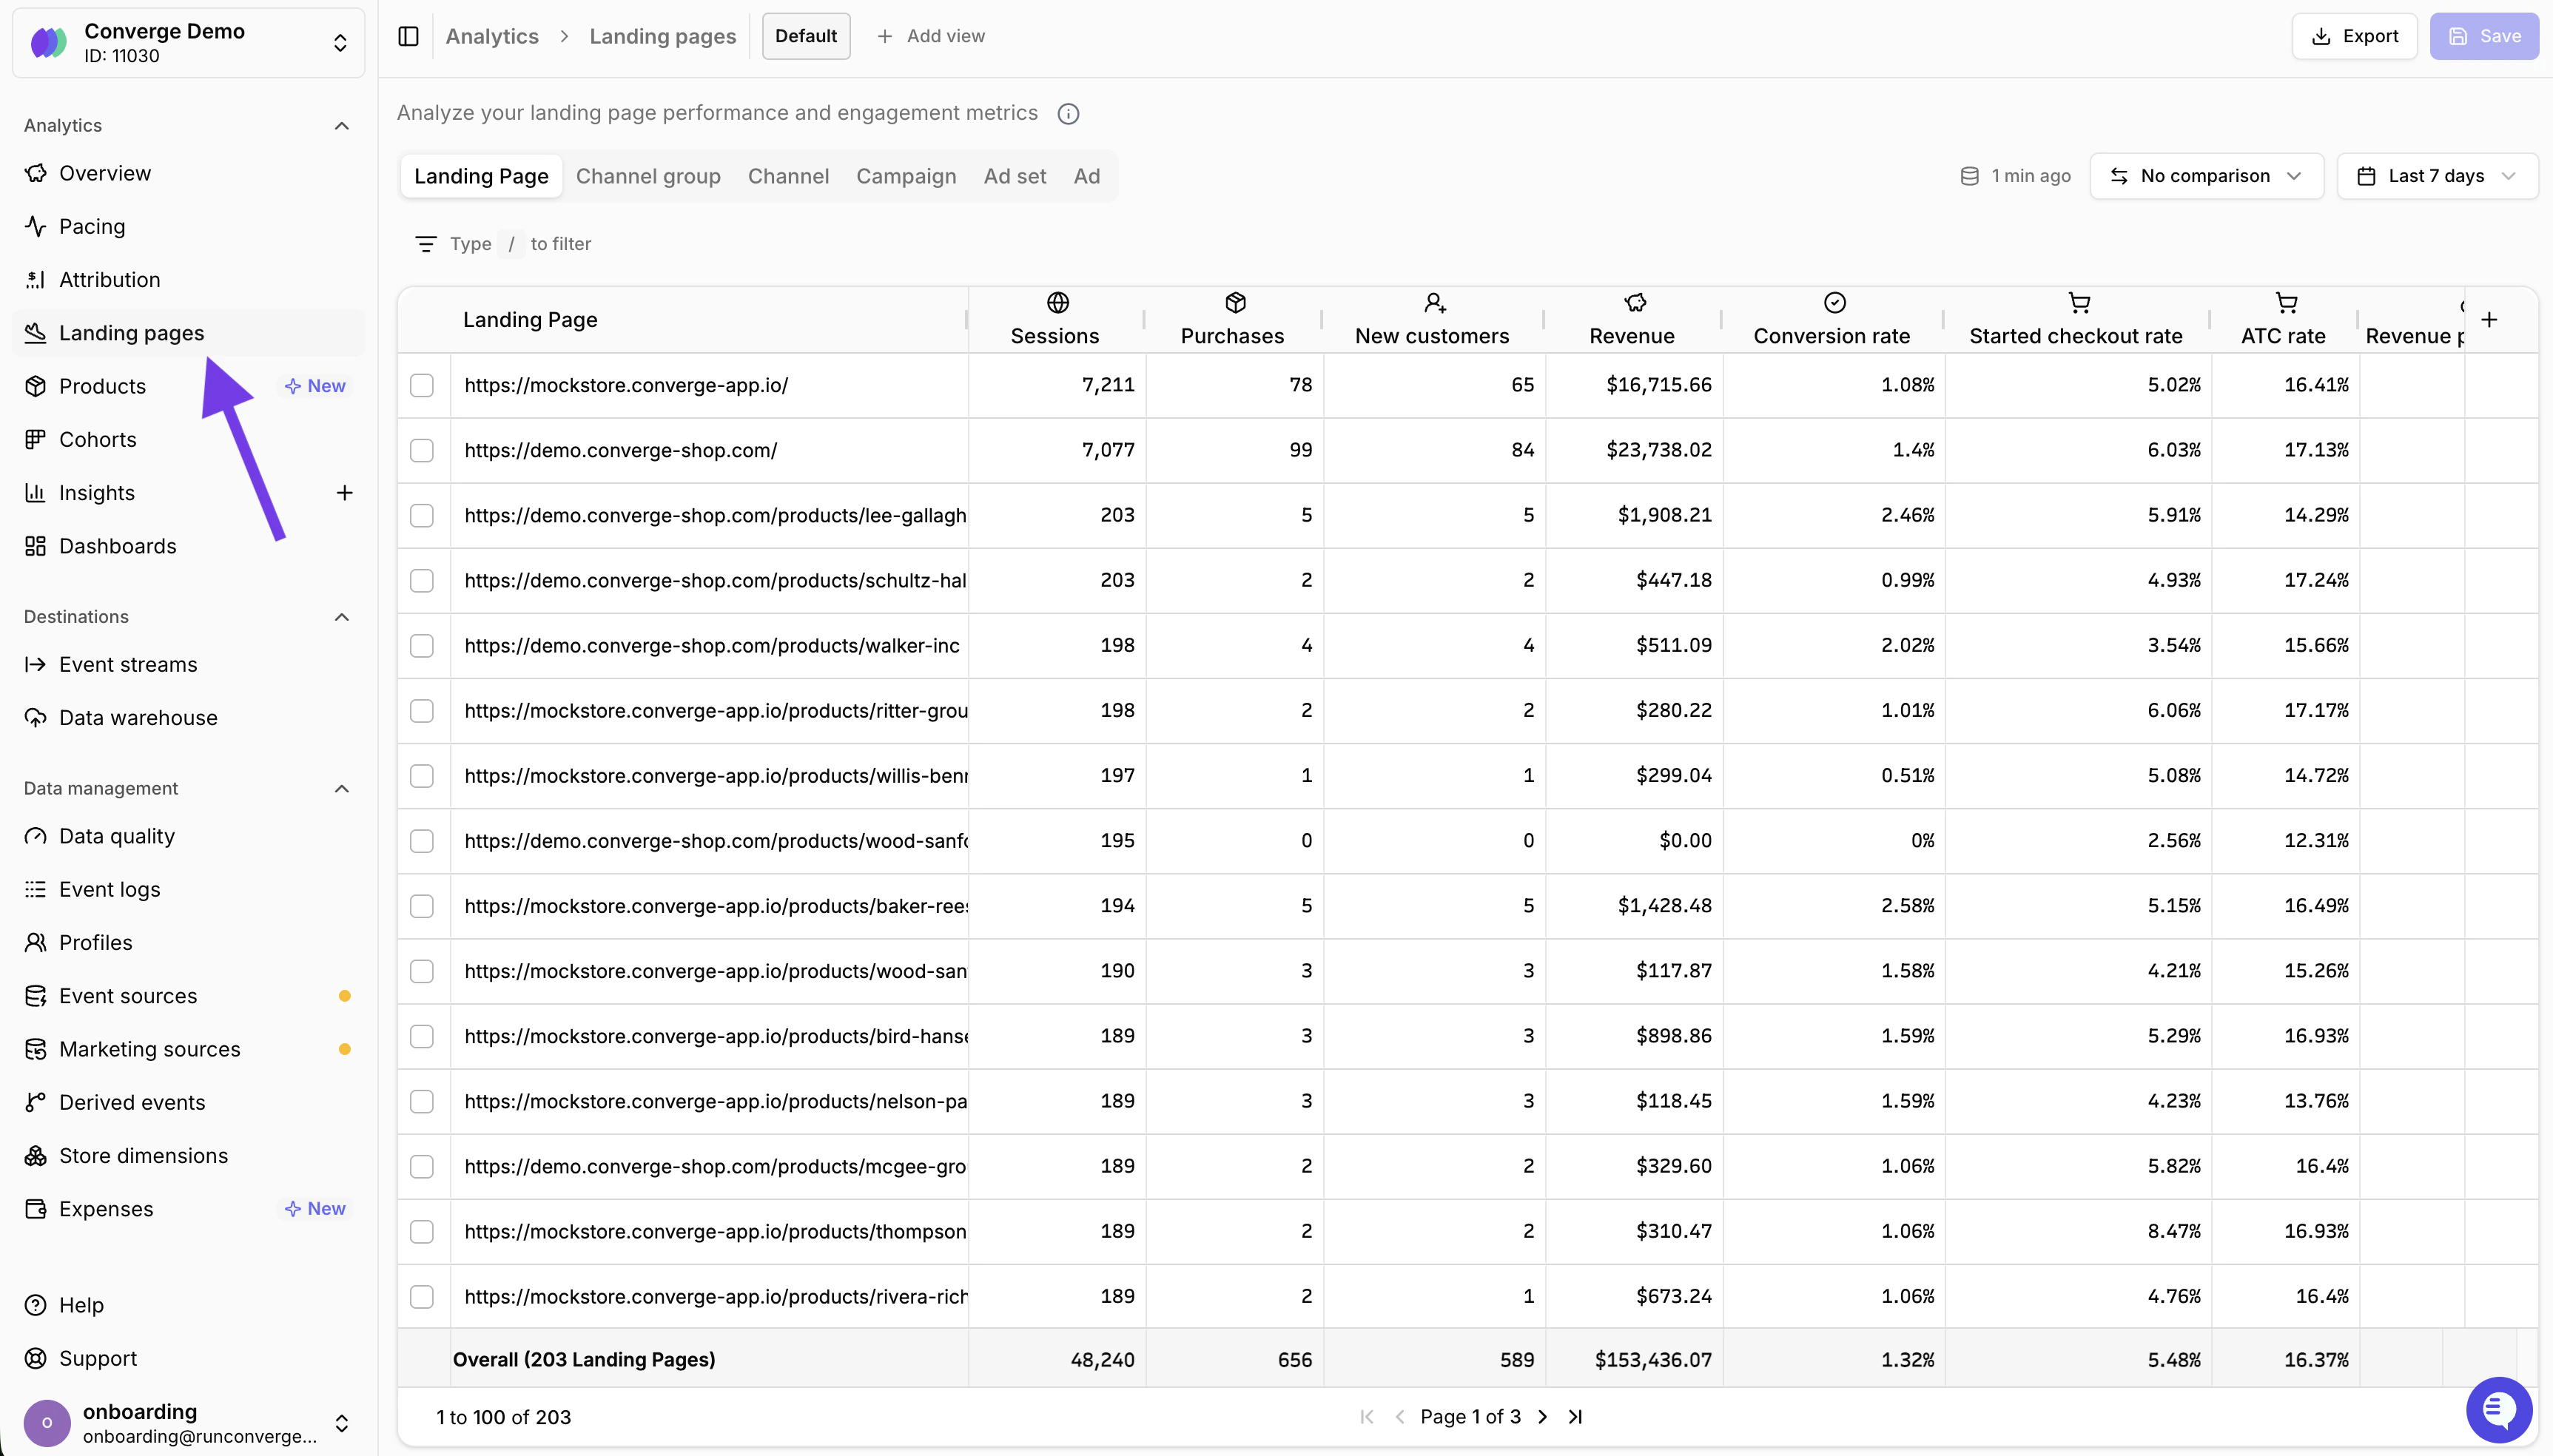
## Landing pages report
The Landing Pages Report shows performance for each page users landed on. Metrics include **sessions**, **purchases**, **revenue**, and **conversion rate**.
You can customize this report to focus on metrics that matter to you.
***
## Landing pages report
The Landing Pages Report shows performance for each page users landed on. Metrics include **sessions**, **purchases**, **revenue**, and **conversion rate**.
You can customize this report to focus on metrics that matter to you.
 ***
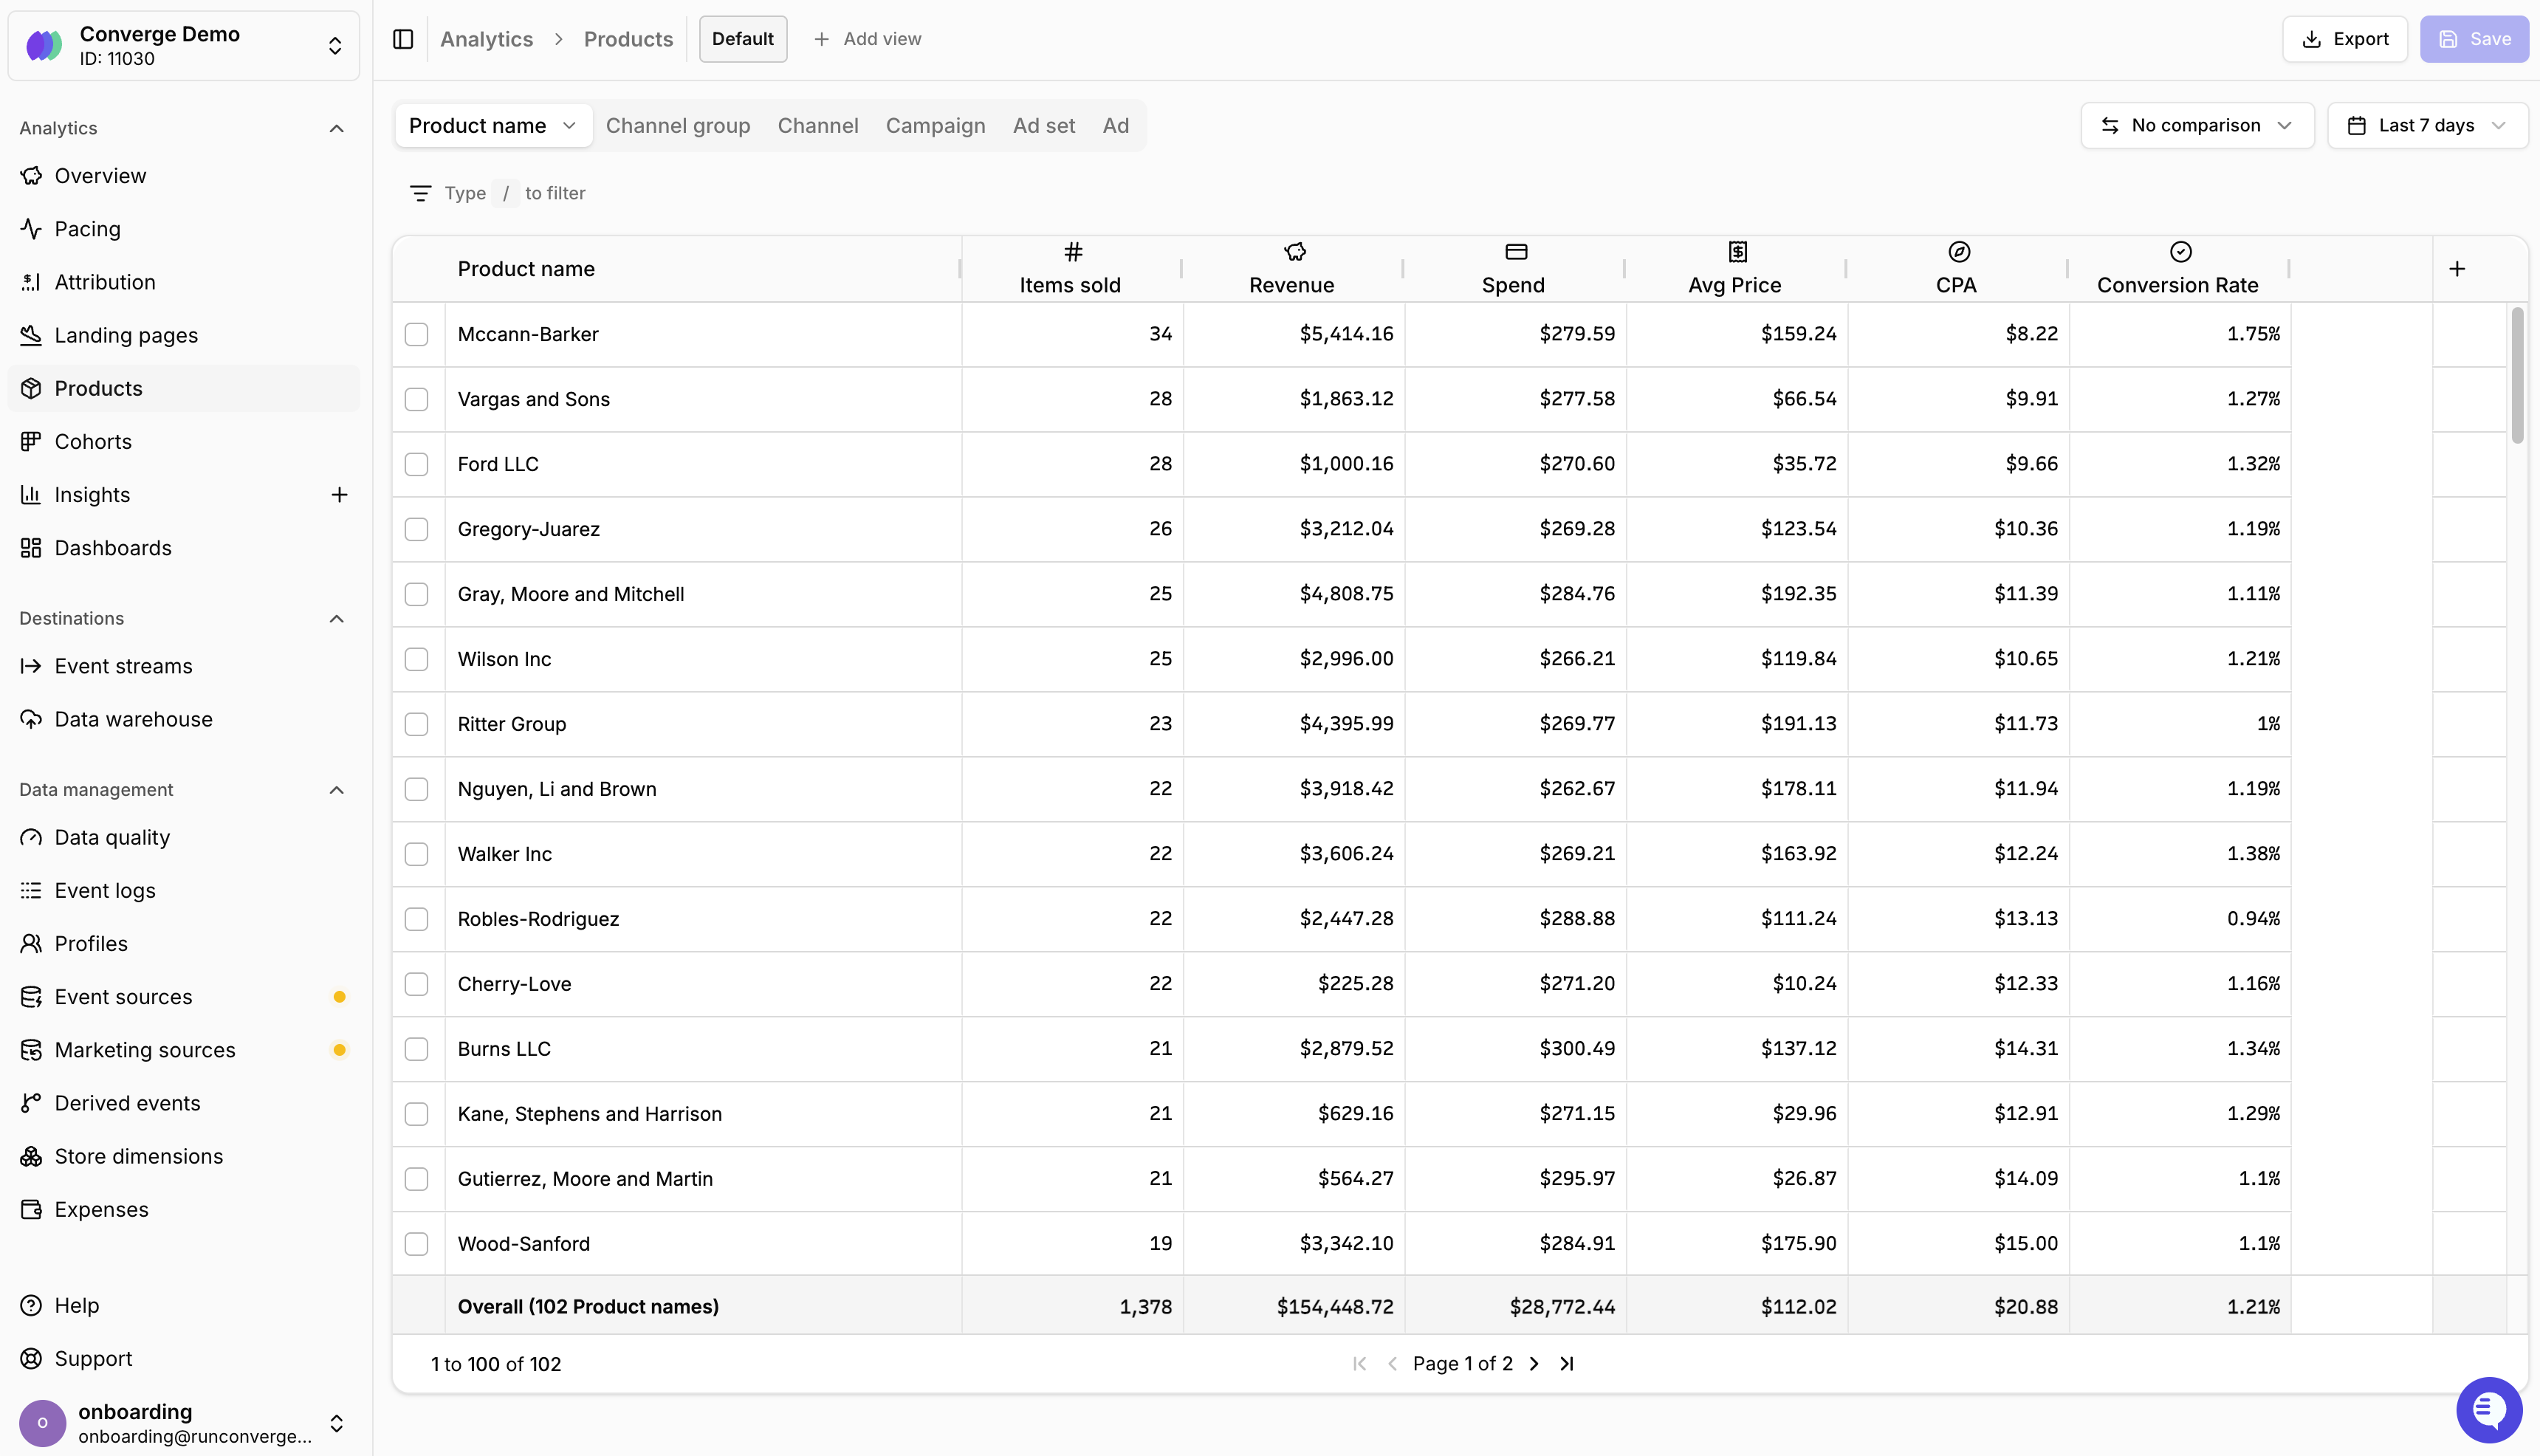
## Product report
The Product Report shows how individual **products** are performing across your store. Use it to make smarter ad buying decisions on a per-product level and scale budgets toward your best performers.
It includes metrics like:
* **Items sold**: Number of units sold per product.
* **Revenue**: Total revenue generated per product.
* **Spend**: Estimated ad spend per product.
* **Average price**: Average selling price per product.
* **CPA**: Cost per acquisition for each product.
* **Conversion rate**: How often views of a product lead to a purchase.
You can filter and sort by any metric to quickly find your top and bottom performers.
**Spend** is calculated by taking your total ad spend and dividing it across products proportionally based on the number of "Viewed Product" events that originated from paid sessions.
***
## Product report
The Product Report shows how individual **products** are performing across your store. Use it to make smarter ad buying decisions on a per-product level and scale budgets toward your best performers.
It includes metrics like:
* **Items sold**: Number of units sold per product.
* **Revenue**: Total revenue generated per product.
* **Spend**: Estimated ad spend per product.
* **Average price**: Average selling price per product.
* **CPA**: Cost per acquisition for each product.
* **Conversion rate**: How often views of a product lead to a purchase.
You can filter and sort by any metric to quickly find your top and bottom performers.
**Spend** is calculated by taking your total ad spend and dividing it across products proportionally based on the number of "Viewed Product" events that originated from paid sessions.
 ***
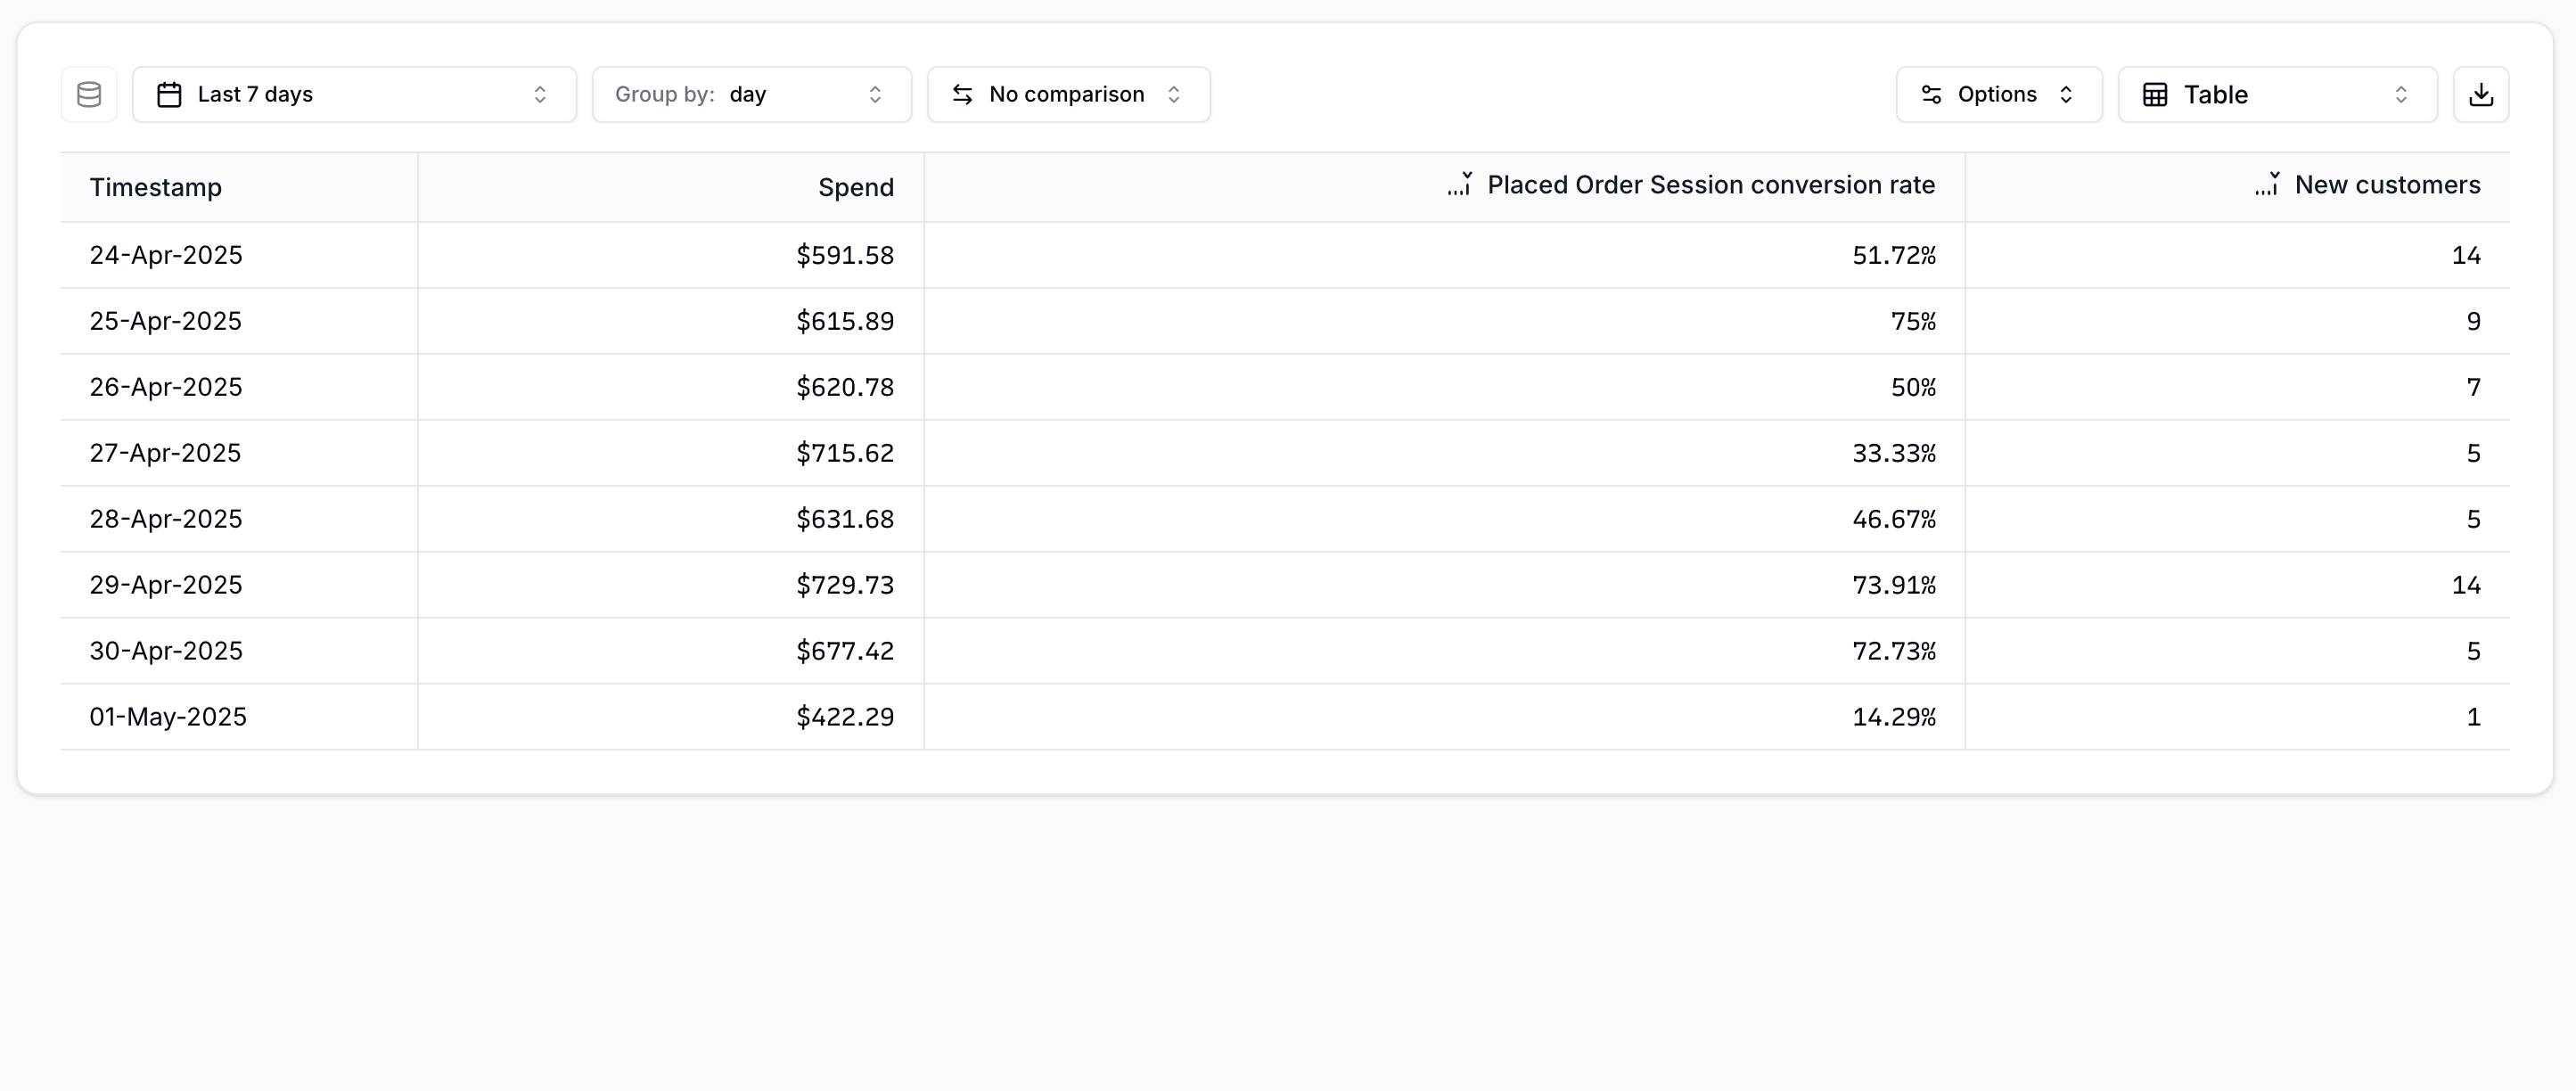
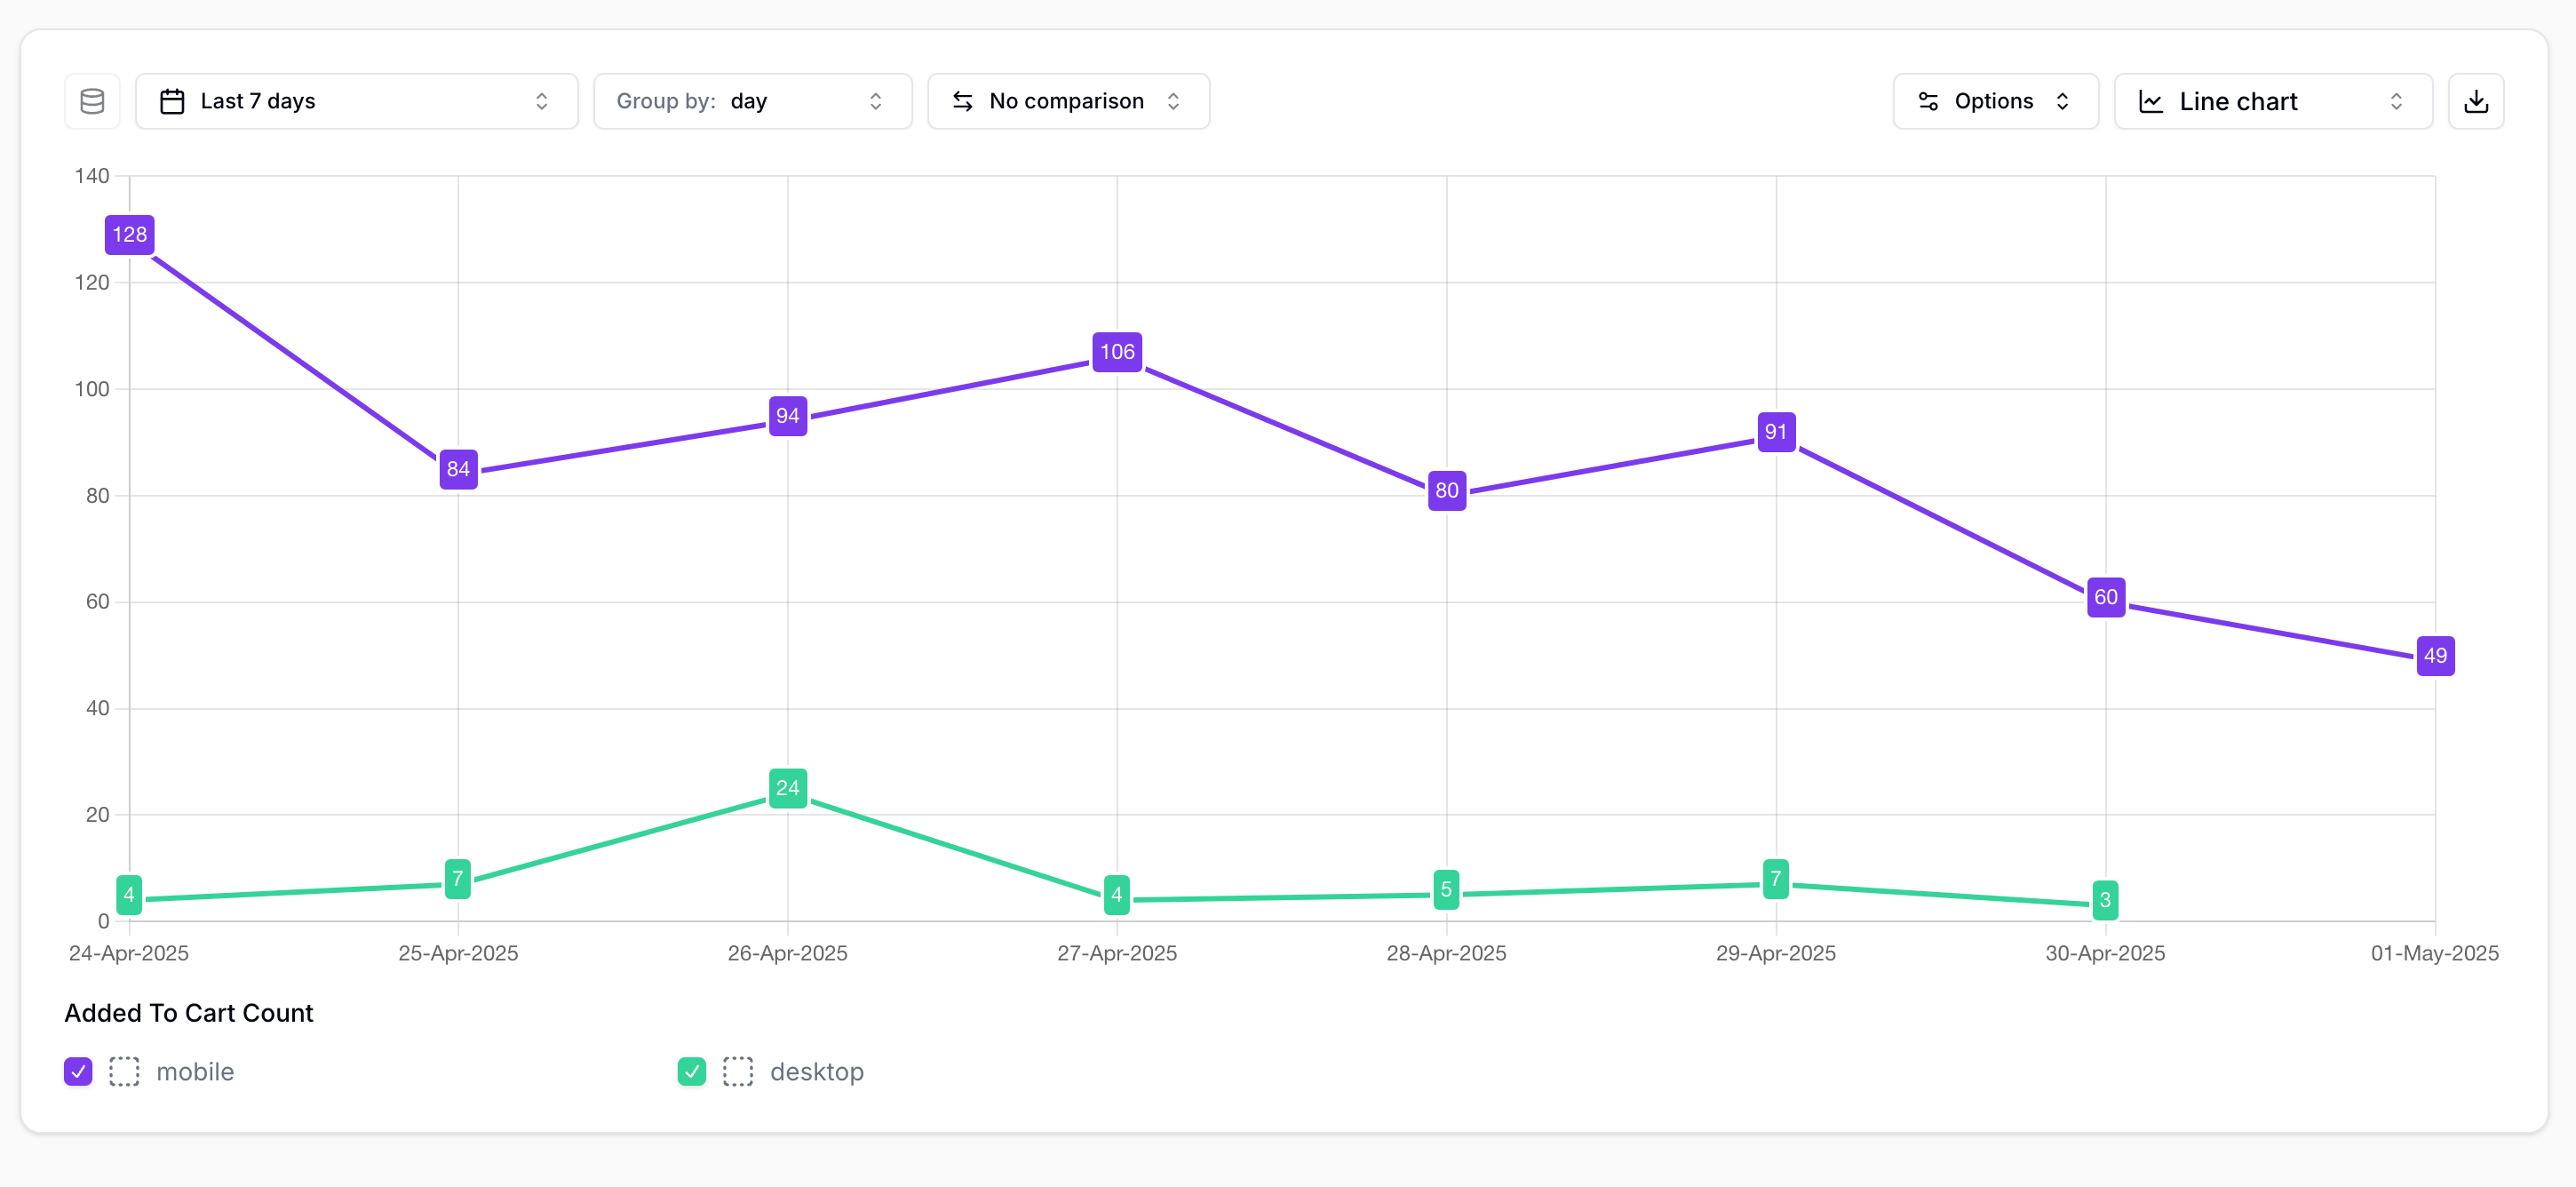
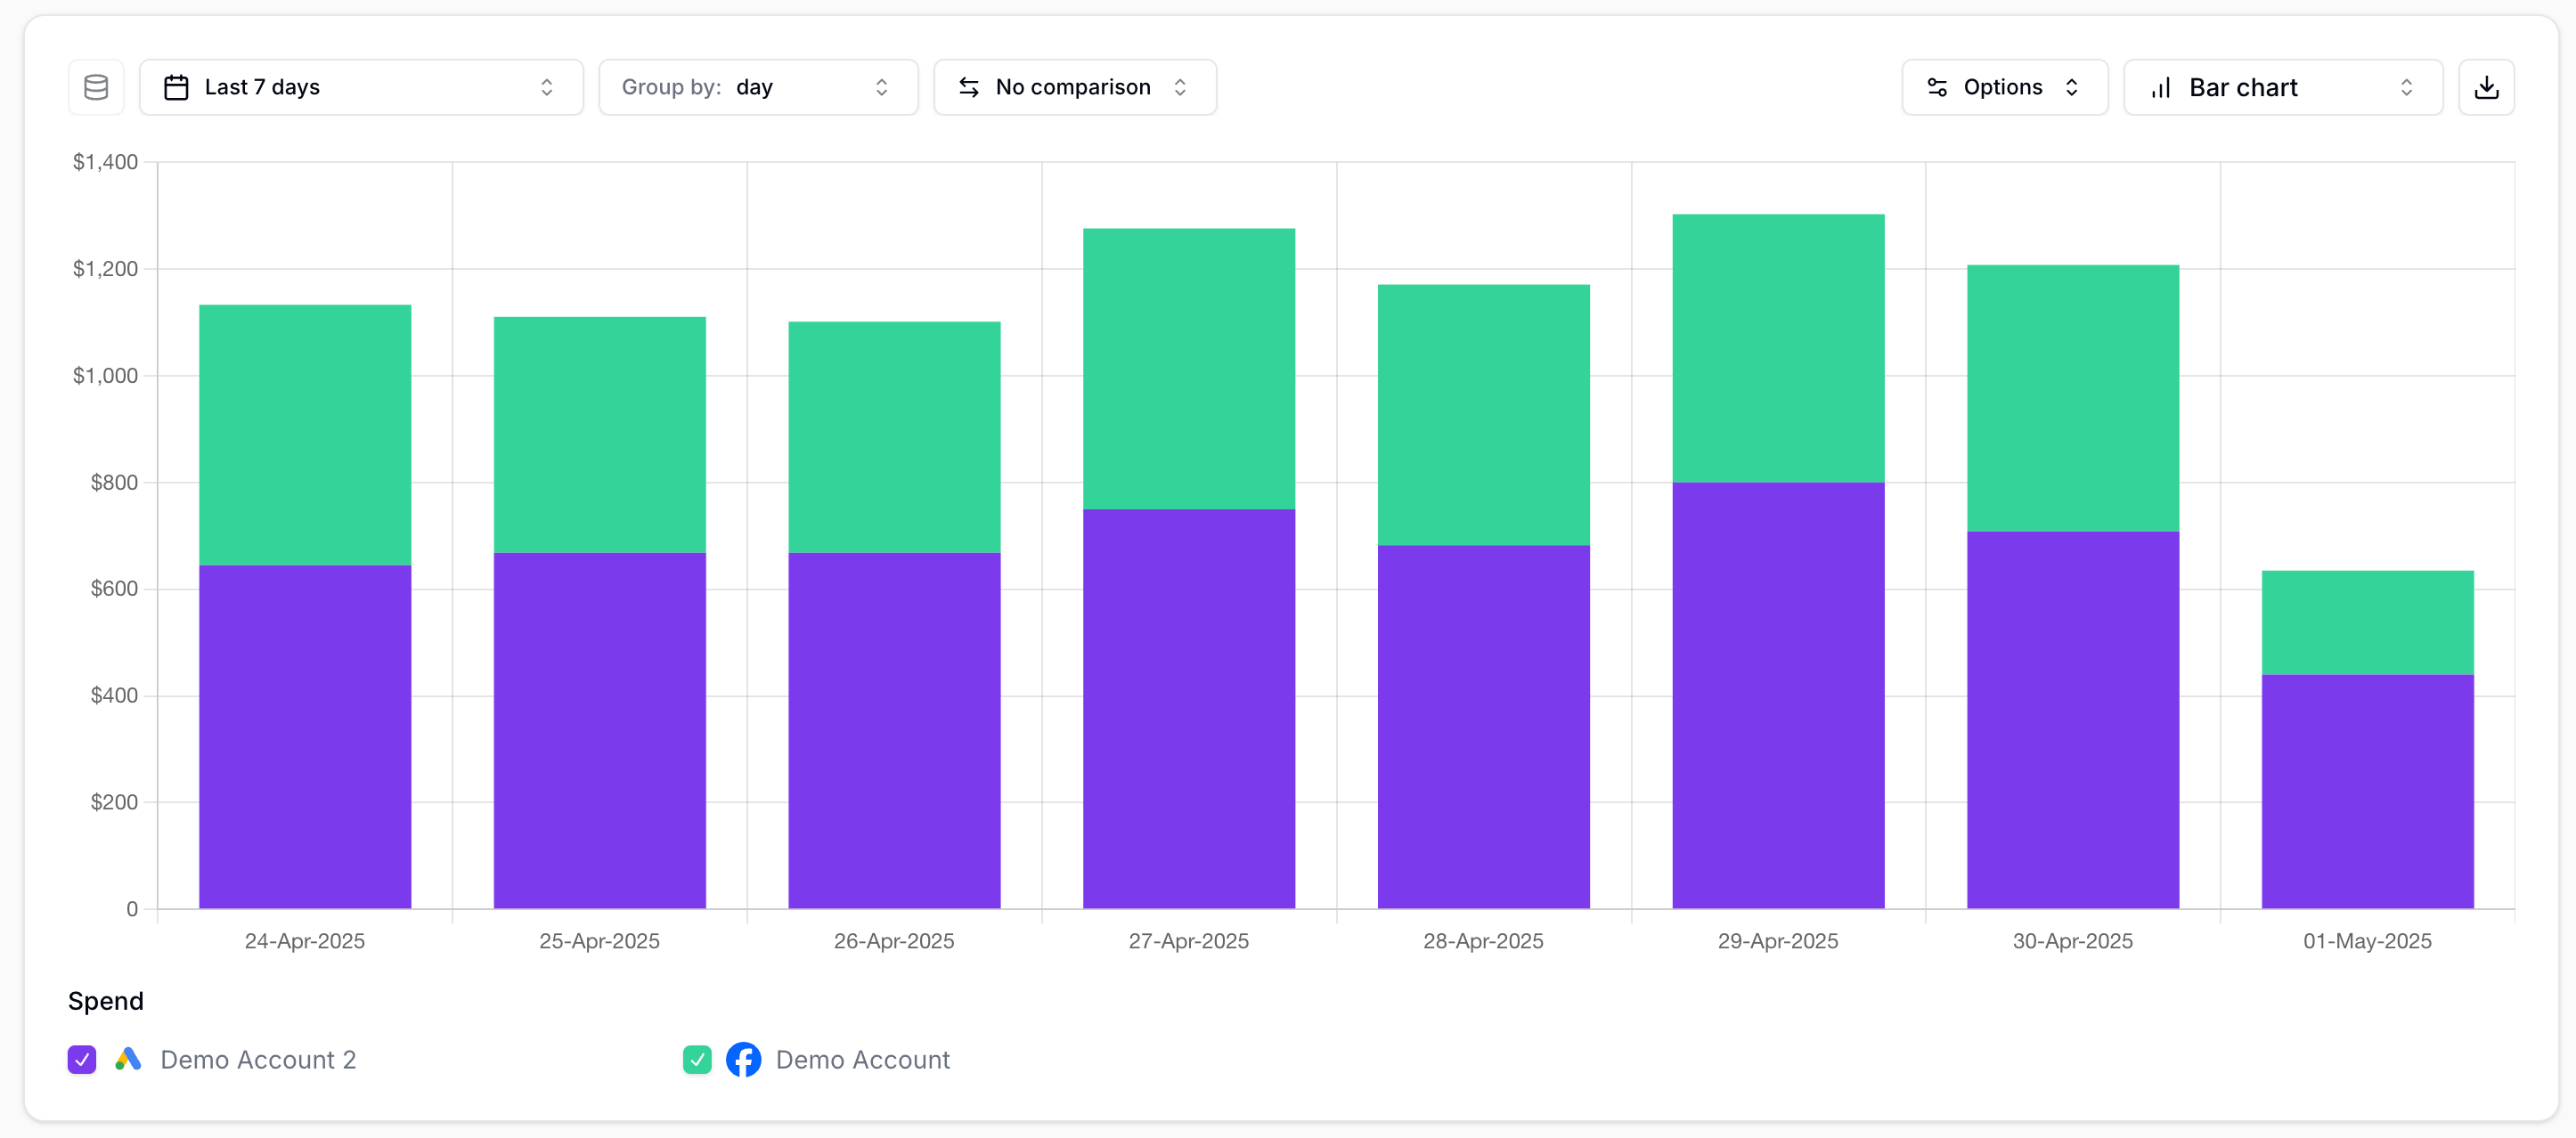
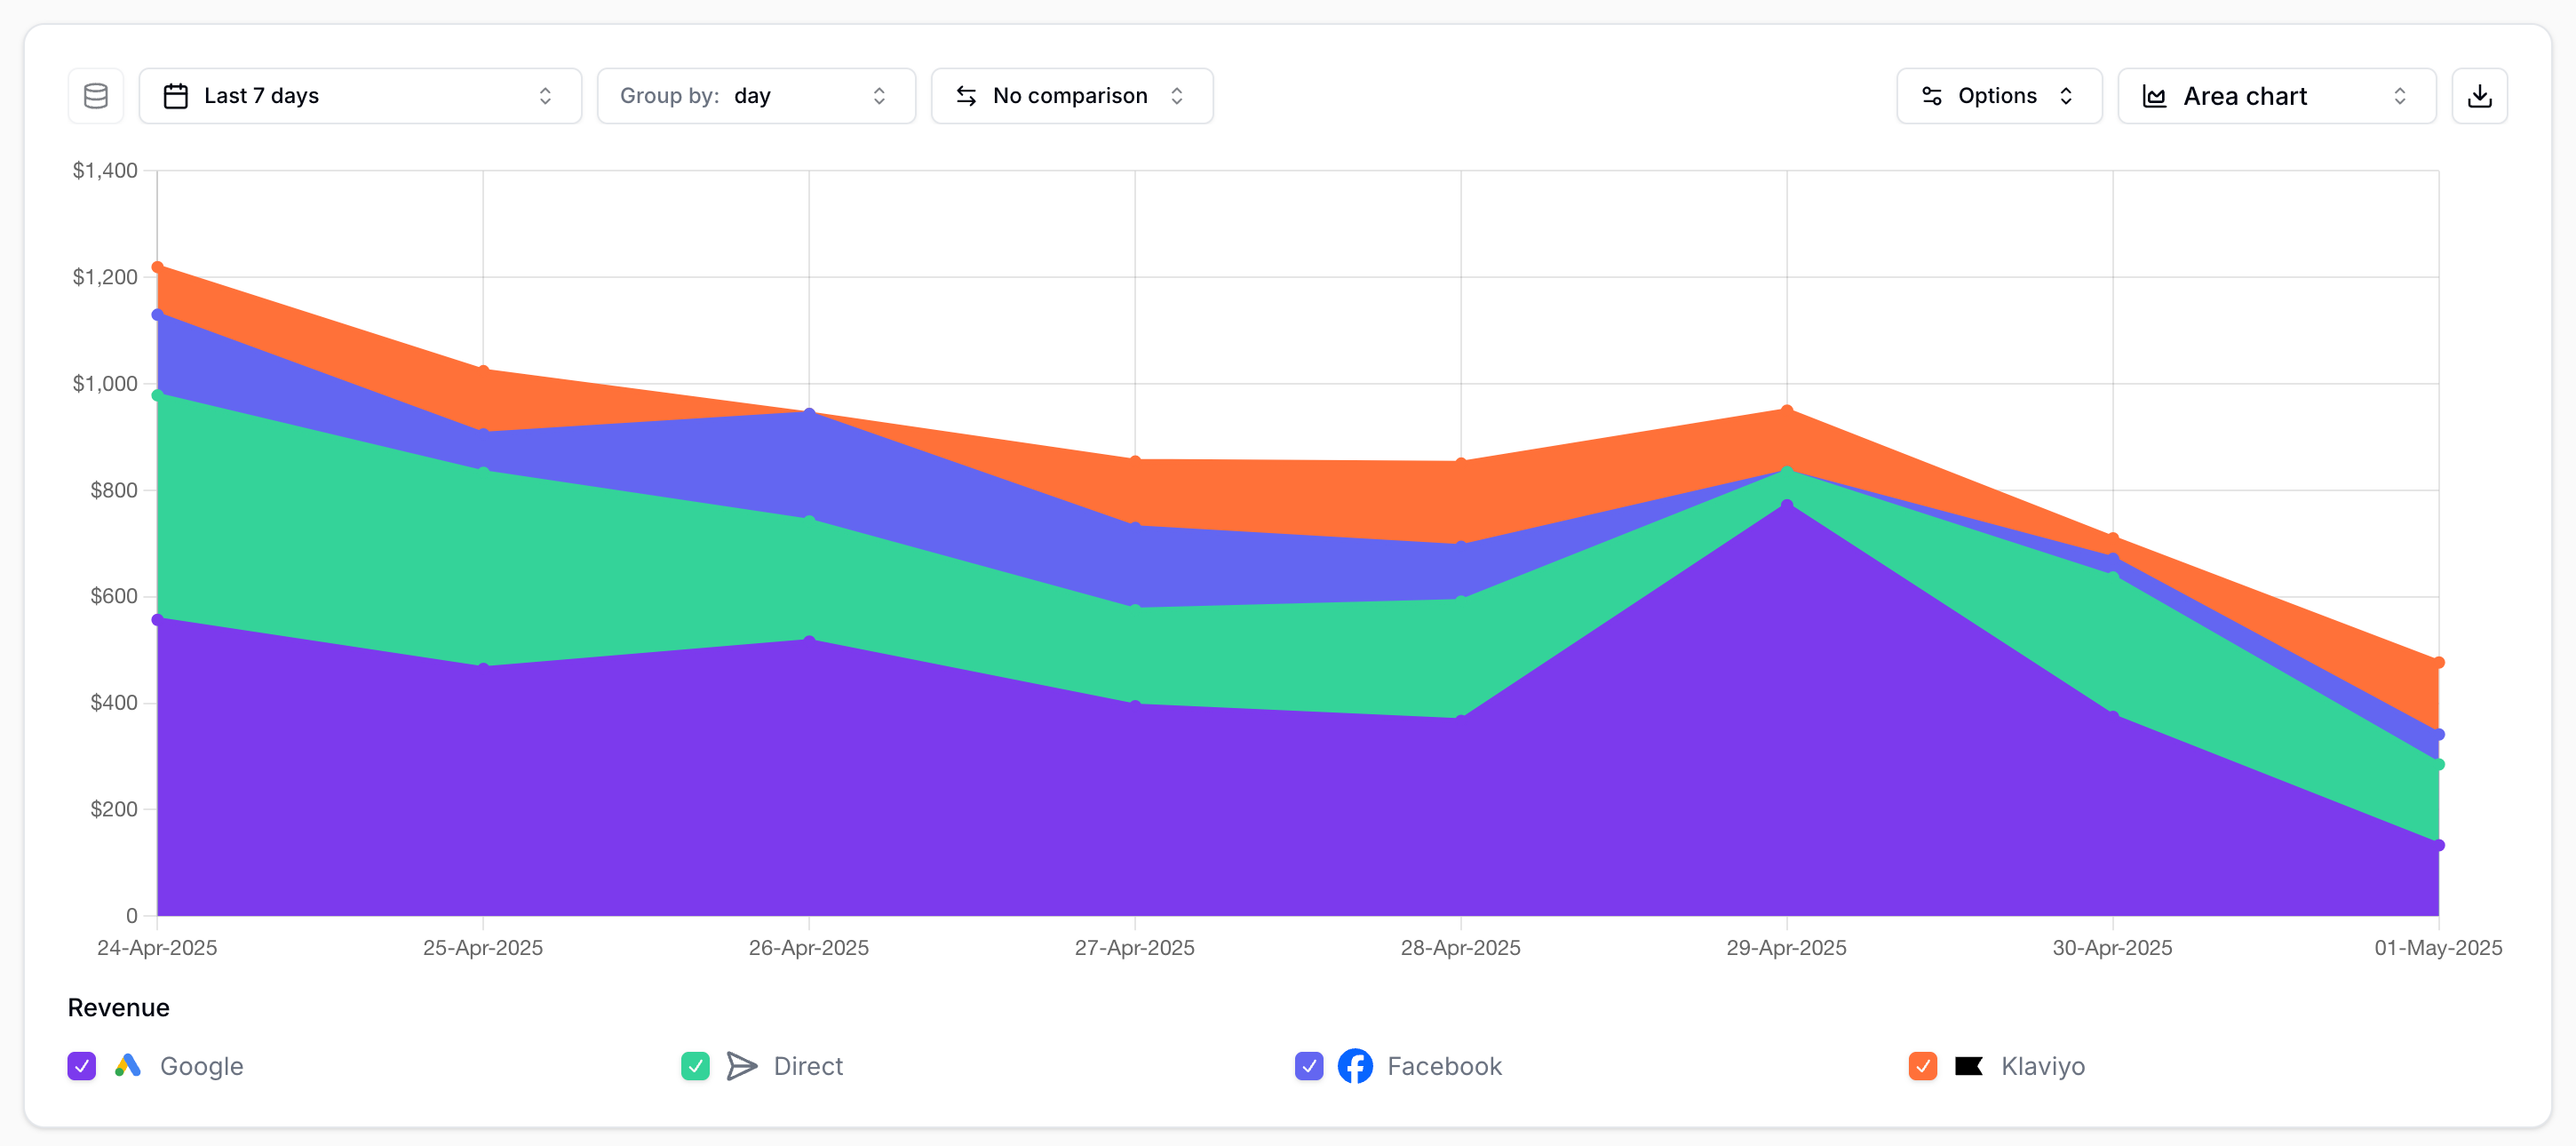
## Insights
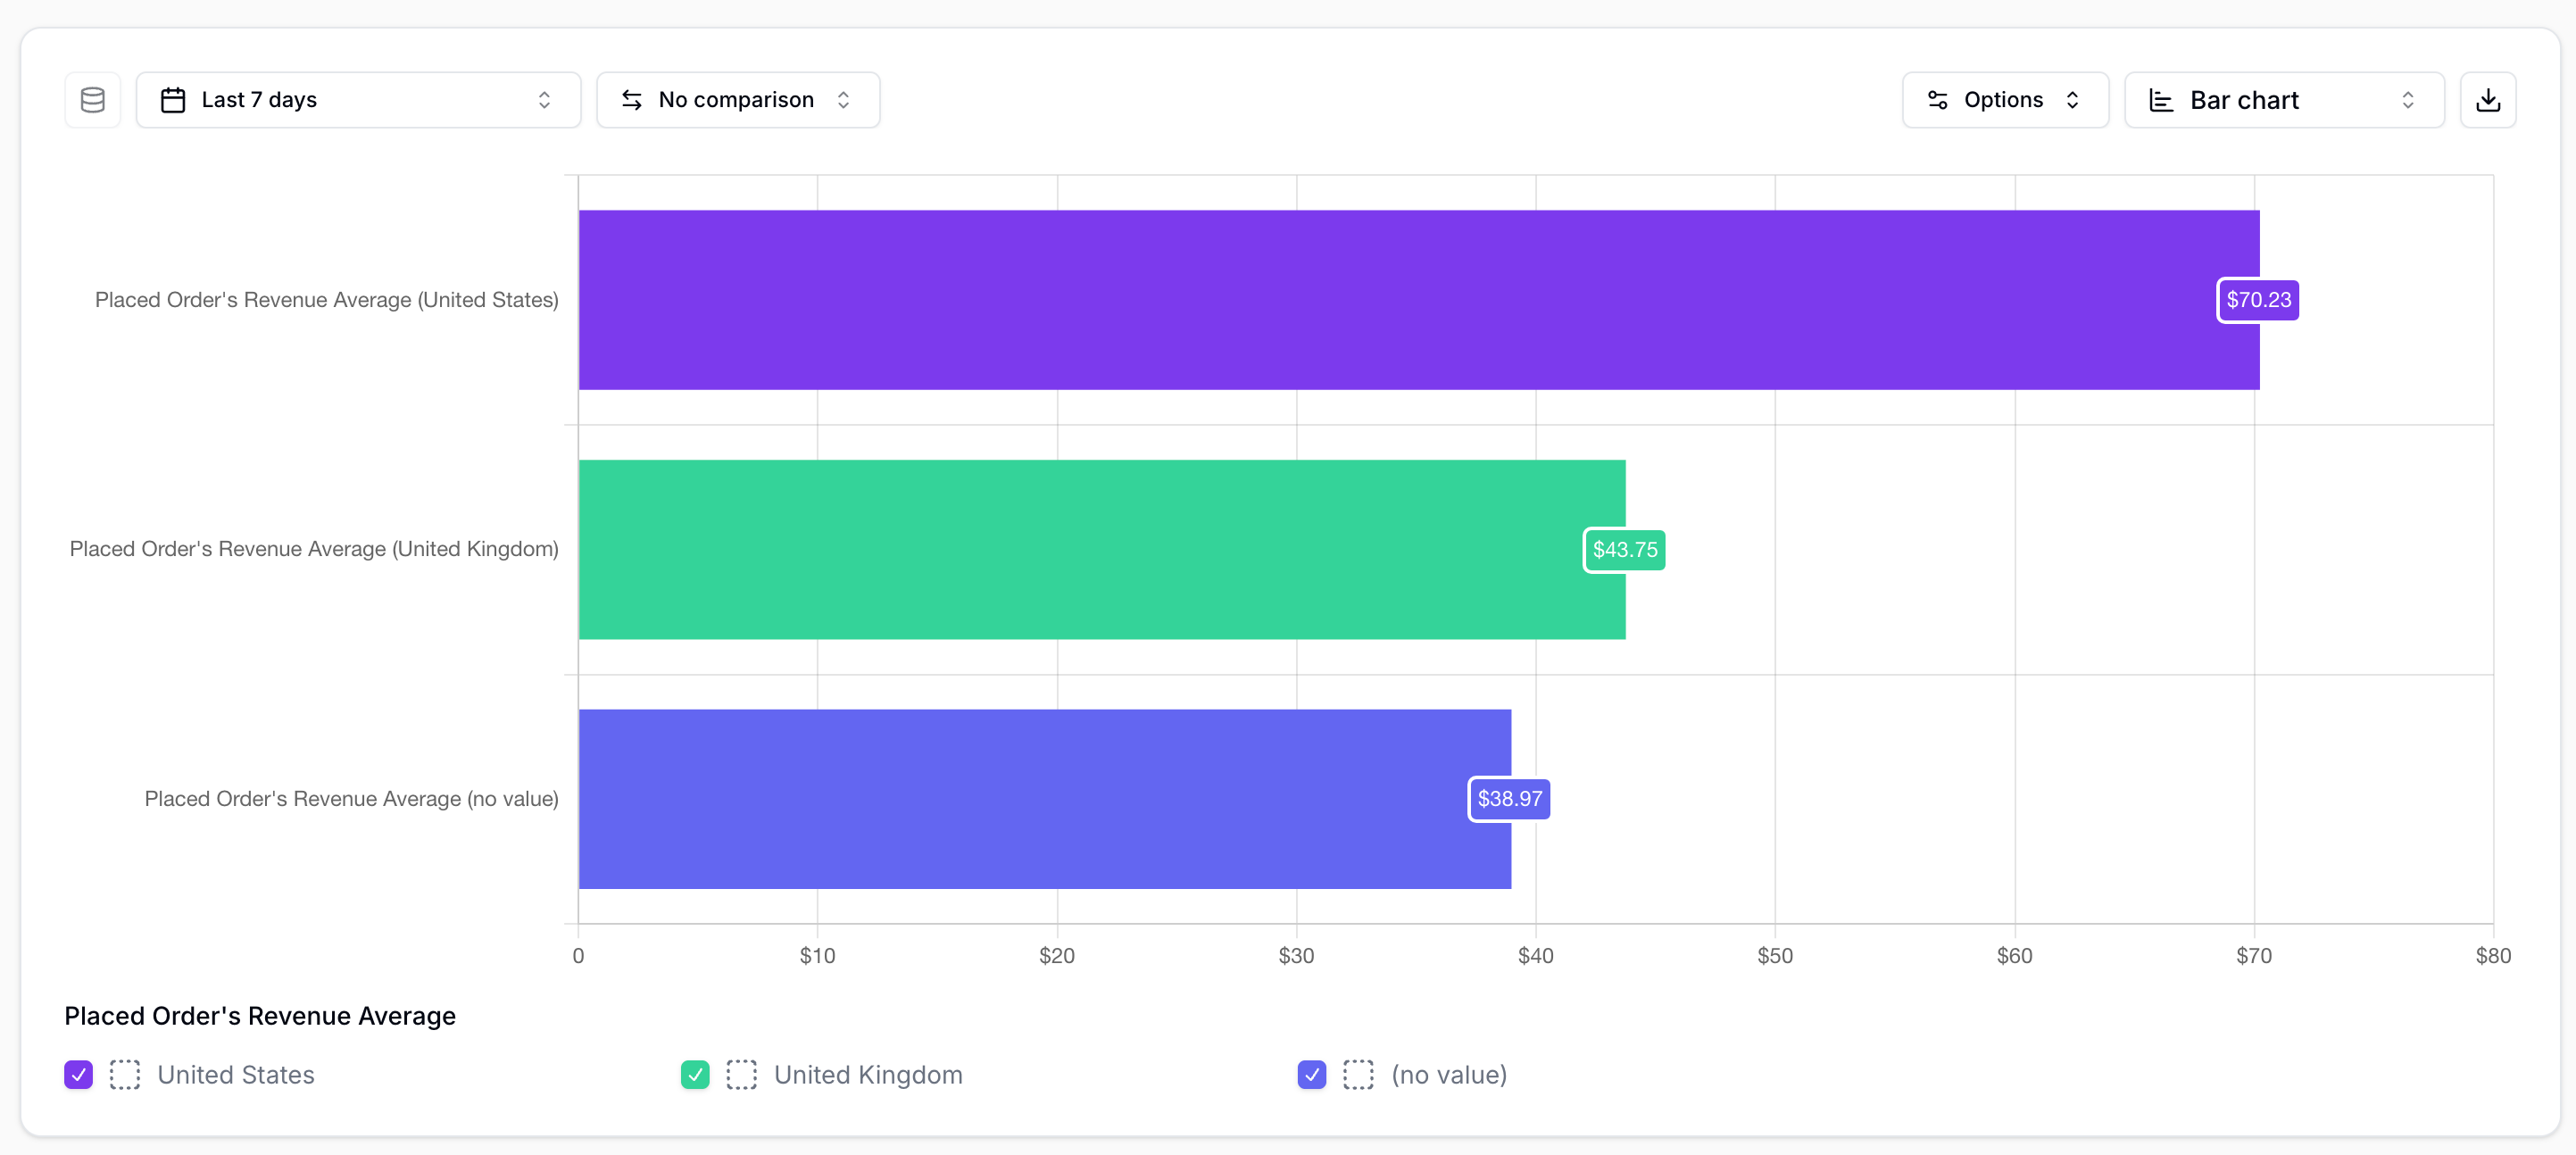
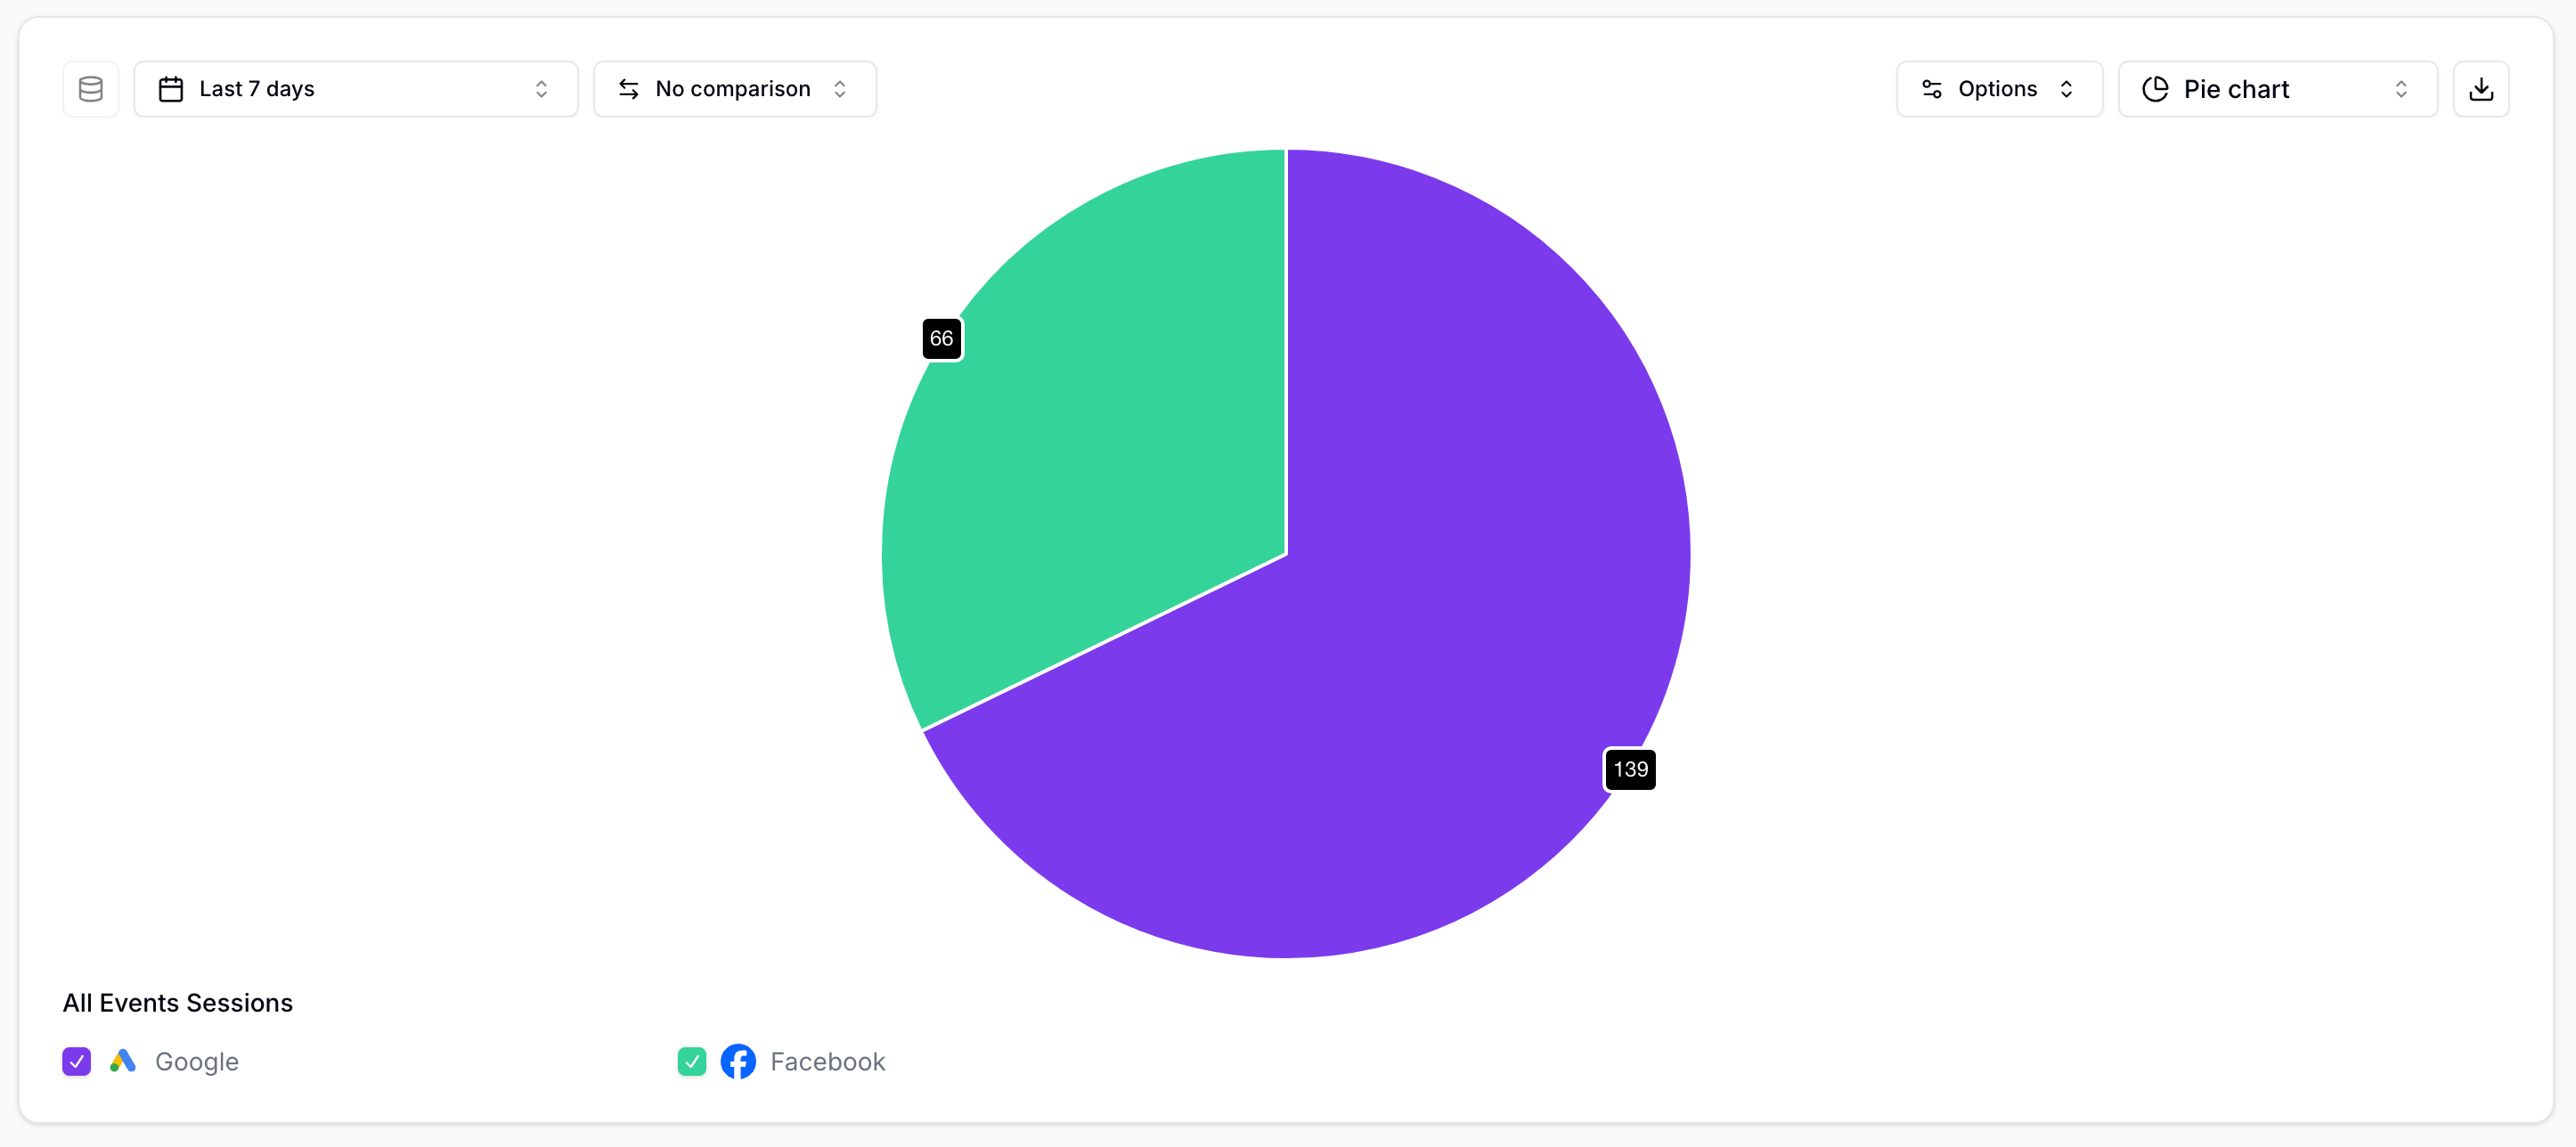
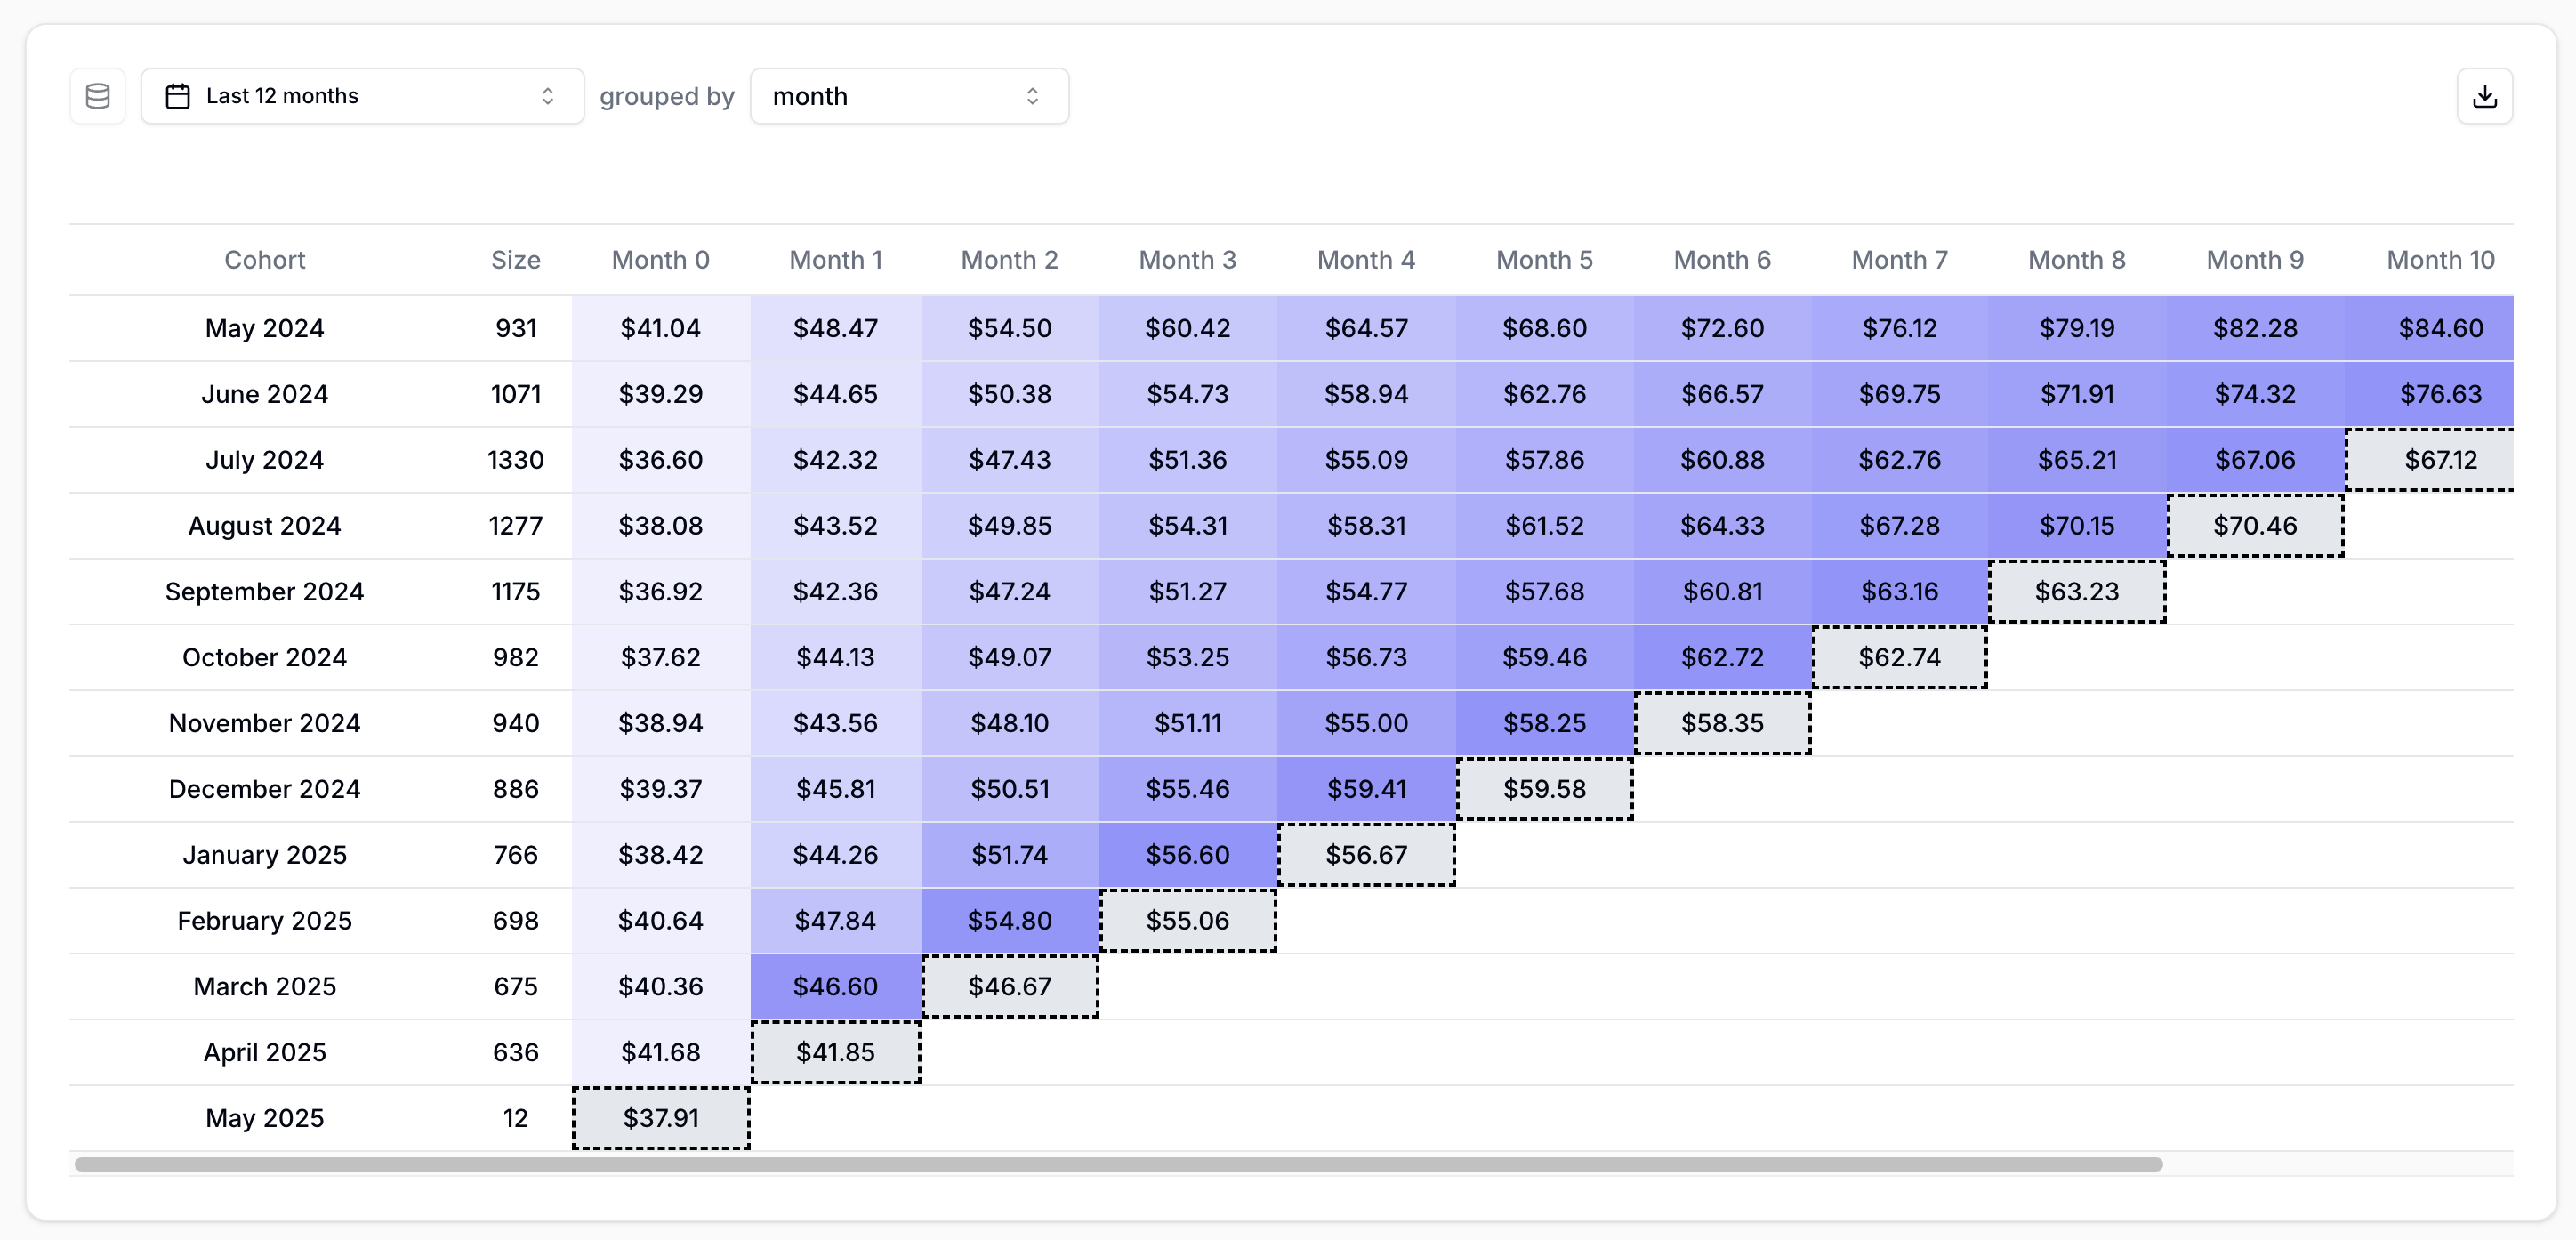
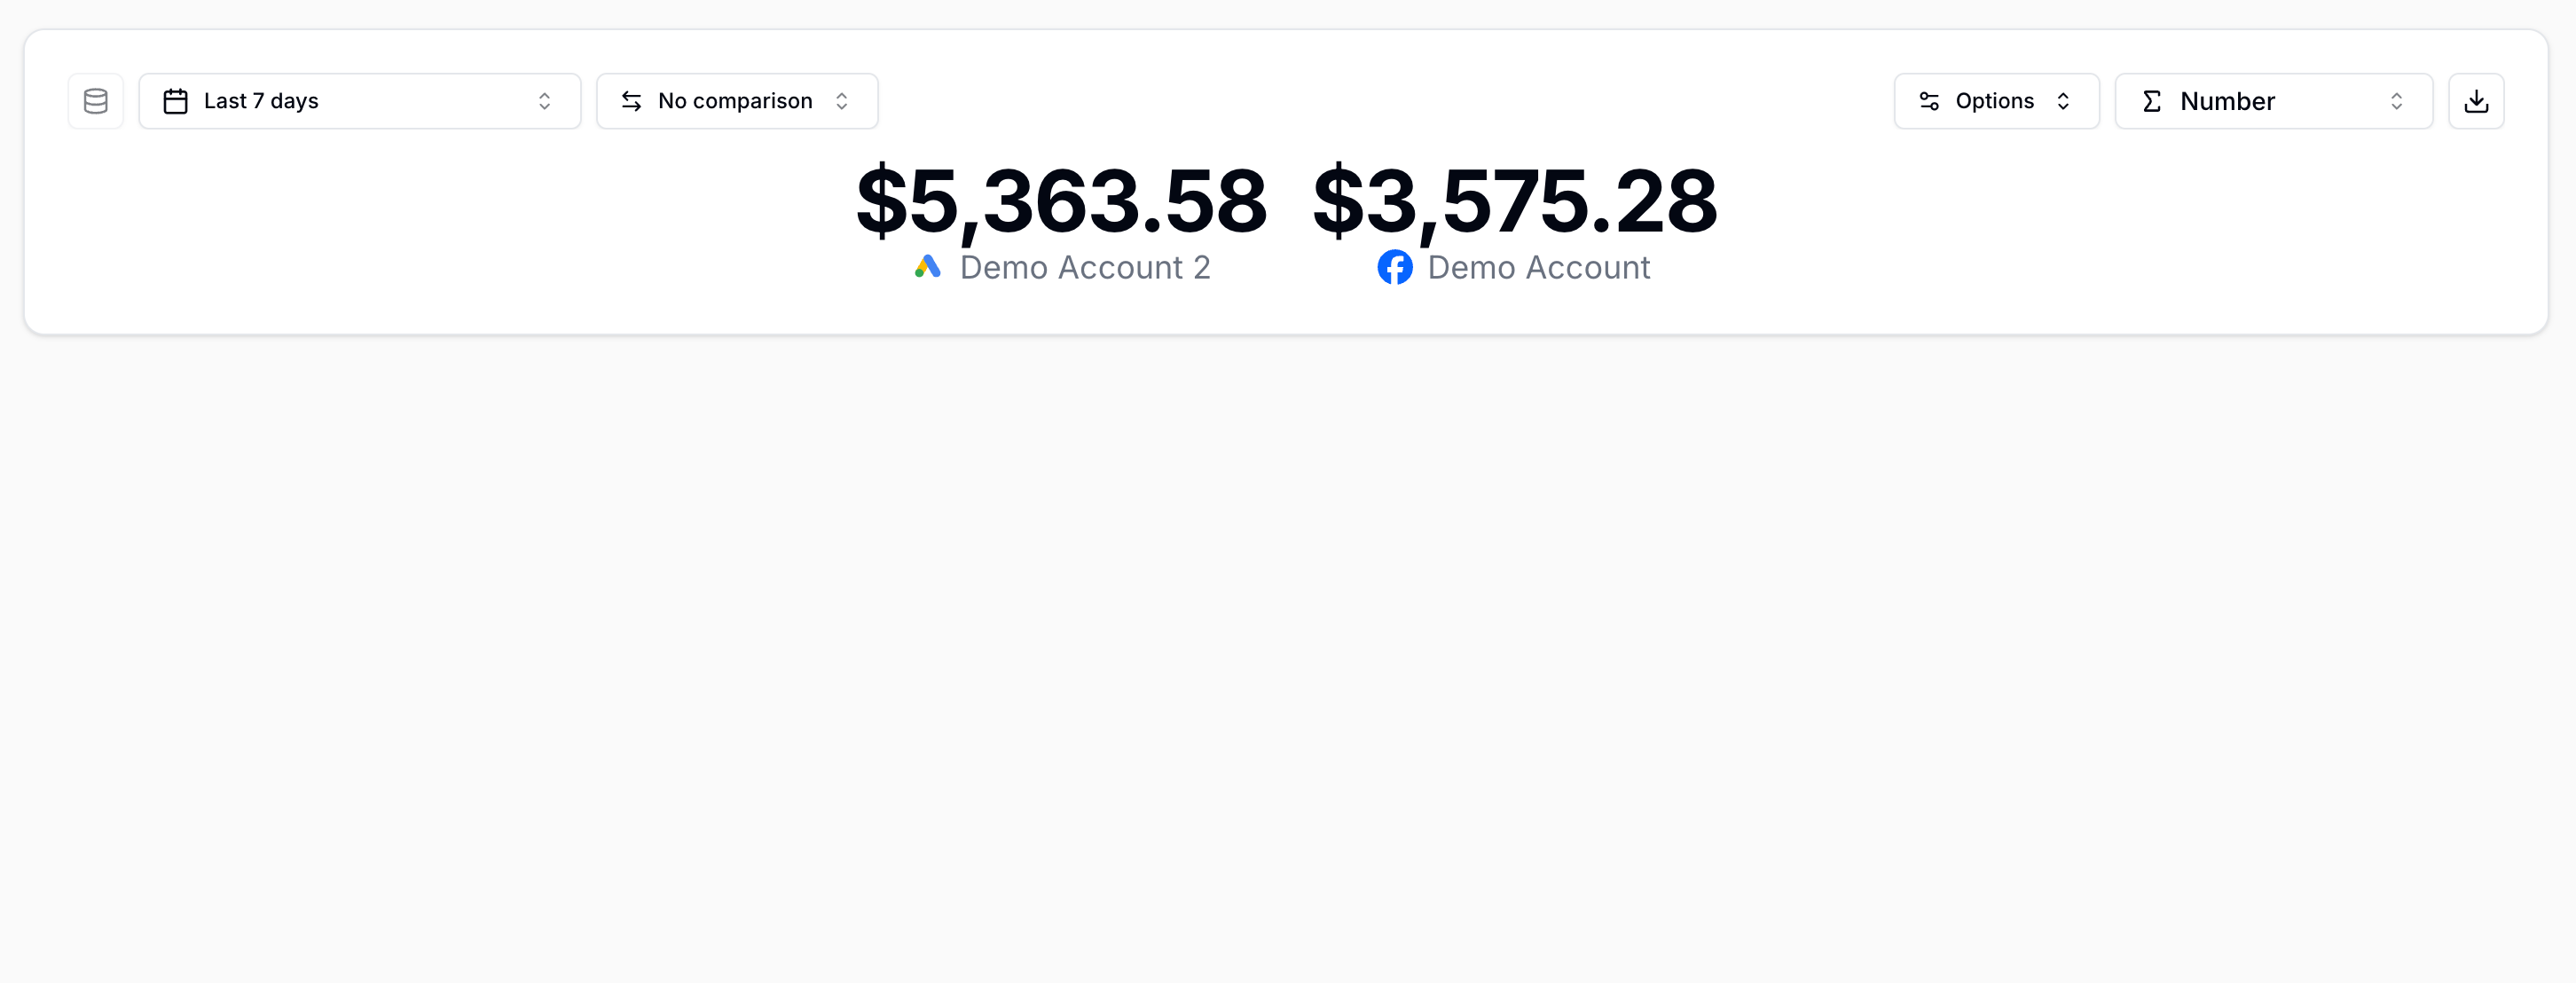
Insights are **custom reports** you can create to further analyze your data. Reports can use data from your **Event sources** and **Marketing sources**, and can show **predefined metrics** or **calculate custom metrics**.
You can visualize Insights as:
| | | |
| :---------------------------------------------------------------------------------------------------------------------------------------------------------------------------------------------------------------------------------------------------------------------------------------------------------------------------------------------------------------------------------------------------------------------------------------------------------------------------------------------------------------------------------------------------------------------------------------------------------------------------------------------------------------------------------------------------------------------------------------------------------------------------------------------------------------------------------------------------------------------------------------------------------------------------------------------------------------------------------------------------------------------------------------------------------------------------------------------------------------------------------------------------------------------------------------------------------------------------------------------------------------------------------------------------------------------------------------------------------------------------------------------------------------------------------------------------------------------------------------------------------------------------------------------------------------------------------------------------------------------------------------------------------------------------------------------------------------------------------------------------- | :---------------------------------------------------------------------------------------------------------------------------------------------------------------------------------------------------------------------------------------------------------------------------------------------------------------------------------------------------------------------------------------------------------------------------------------------------------------------------------------------------------------------------------------------------------------------------------------------------------------------------------------------------------------------------------------------------------------------------------------------------------------------------------------------------------------------------------------------------------------------------------------------------------------------------------------------------------------------------------------------------------------------------------------------------------------------------------------------------------------------------------------------------------------------------------------------------------------------------------------------------------------------------------------------------------------------------------------------------------------------------------------------------------------------------------------------------------------------------------------------------------------------------------------------------------------------------------------------------------------------------------------------------------------------------------------------------------------------------------------------------------------------------------------------------------------------------------------------- | - |
|
***
## Insights
Insights are **custom reports** you can create to further analyze your data. Reports can use data from your **Event sources** and **Marketing sources**, and can show **predefined metrics** or **calculate custom metrics**.
You can visualize Insights as:
| | | |
| :---------------------------------------------------------------------------------------------------------------------------------------------------------------------------------------------------------------------------------------------------------------------------------------------------------------------------------------------------------------------------------------------------------------------------------------------------------------------------------------------------------------------------------------------------------------------------------------------------------------------------------------------------------------------------------------------------------------------------------------------------------------------------------------------------------------------------------------------------------------------------------------------------------------------------------------------------------------------------------------------------------------------------------------------------------------------------------------------------------------------------------------------------------------------------------------------------------------------------------------------------------------------------------------------------------------------------------------------------------------------------------------------------------------------------------------------------------------------------------------------------------------------------------------------------------------------------------------------------------------------------------------------------------------------------------------------------------------------------------------------------- | :---------------------------------------------------------------------------------------------------------------------------------------------------------------------------------------------------------------------------------------------------------------------------------------------------------------------------------------------------------------------------------------------------------------------------------------------------------------------------------------------------------------------------------------------------------------------------------------------------------------------------------------------------------------------------------------------------------------------------------------------------------------------------------------------------------------------------------------------------------------------------------------------------------------------------------------------------------------------------------------------------------------------------------------------------------------------------------------------------------------------------------------------------------------------------------------------------------------------------------------------------------------------------------------------------------------------------------------------------------------------------------------------------------------------------------------------------------------------------------------------------------------------------------------------------------------------------------------------------------------------------------------------------------------------------------------------------------------------------------------------------------------------------------------------------------------------------------------------- | - |
|  |
|  | |
|
| |
|  |
|  | |
|
| |
|  |
|  | |
|
| |
|  |
|  | |
***
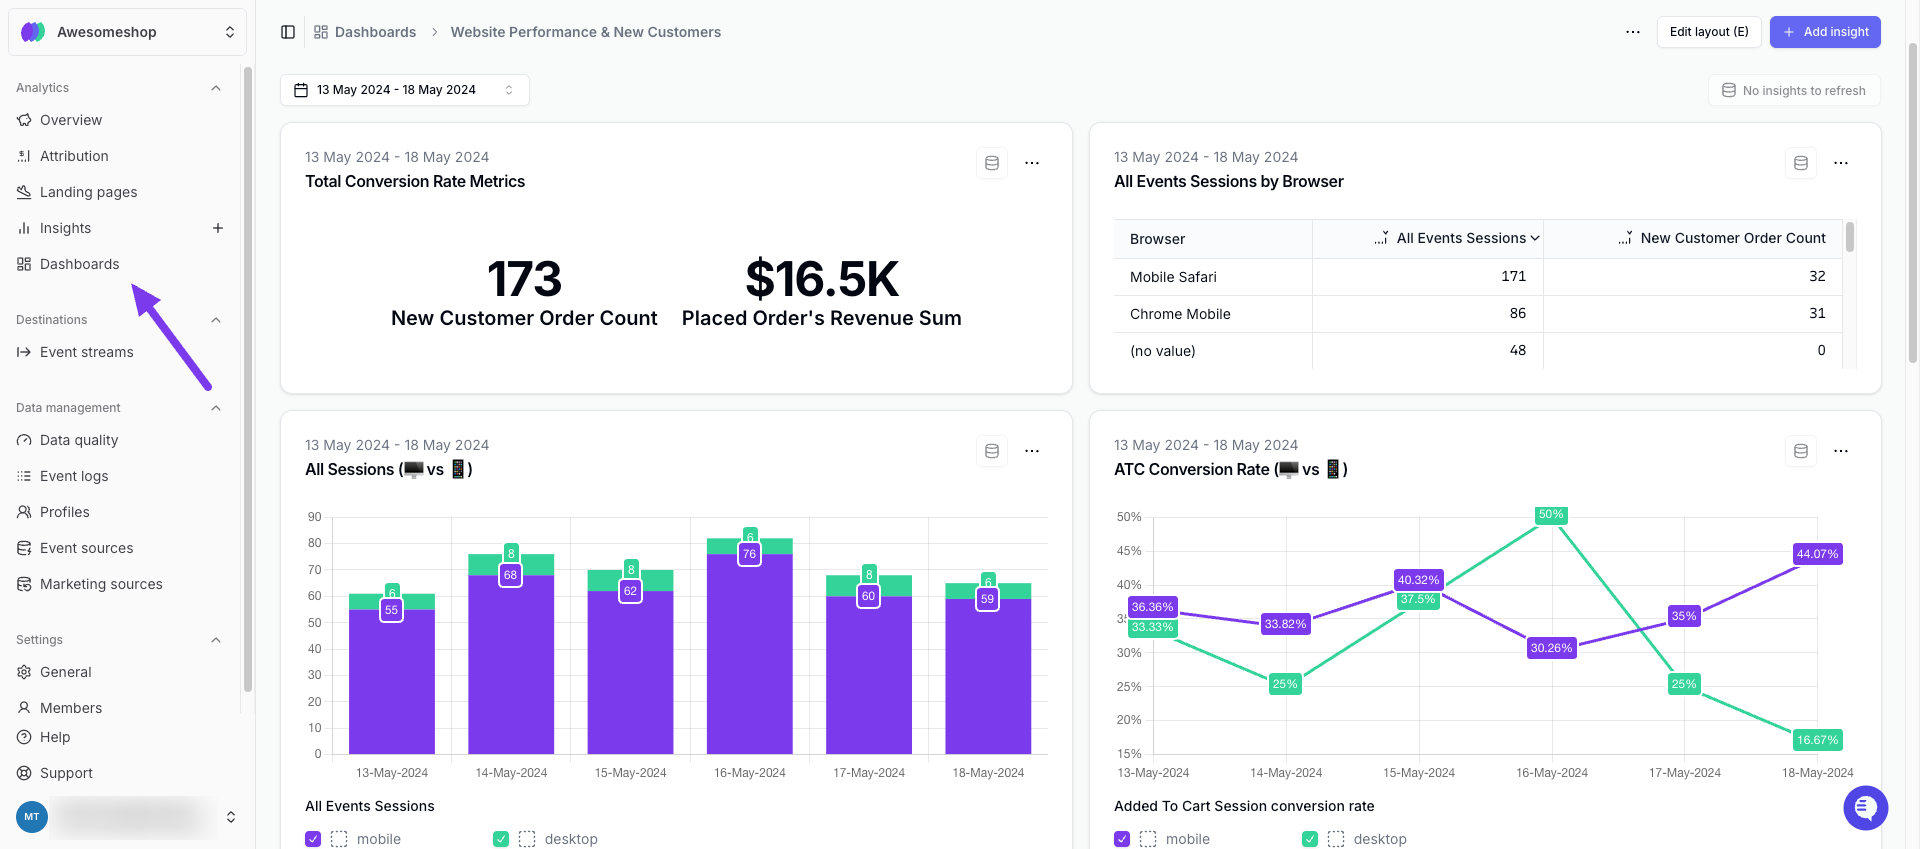
## Dashboards
Dashboards are **custom overviews** where you can view multiple **Insights** side-by-side.
You can rearrange the layout to make dashboards easy to read.
| |
***
## Dashboards
Dashboards are **custom overviews** where you can view multiple **Insights** side-by-side.
You can rearrange the layout to make dashboards easy to read.
 ***
## Further reading
* [Learn how attribution works in Converge](/attribution/introduction)
* [Learn how to use the Overview Report](/attribution/overview)
* [Learn how to use the Pacing Sheet](/attribution/pacing)
* [Learn how to use the Attribution Report](/attribution/channels)
* [Learn how to use the Products Report](/attribution/products)
* [Learn how to create Insights](/insights-dashboards/insights)
* [Learn how to create Dashboards](/insights-dashboards/dashboards)
***
## Further reading
* [Learn how attribution works in Converge](/attribution/introduction)
* [Learn how to use the Overview Report](/attribution/overview)
* [Learn how to use the Pacing Sheet](/attribution/pacing)
* [Learn how to use the Attribution Report](/attribution/channels)
* [Learn how to use the Products Report](/attribution/products)
* [Learn how to create Insights](/insights-dashboards/insights)
* [Learn how to create Dashboards](/insights-dashboards/dashboards)