 3. Click on
 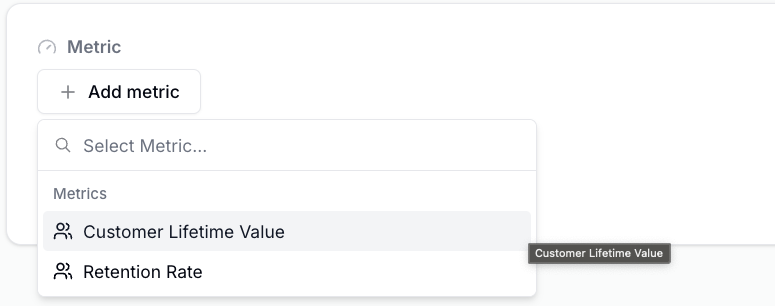 5. Click on
 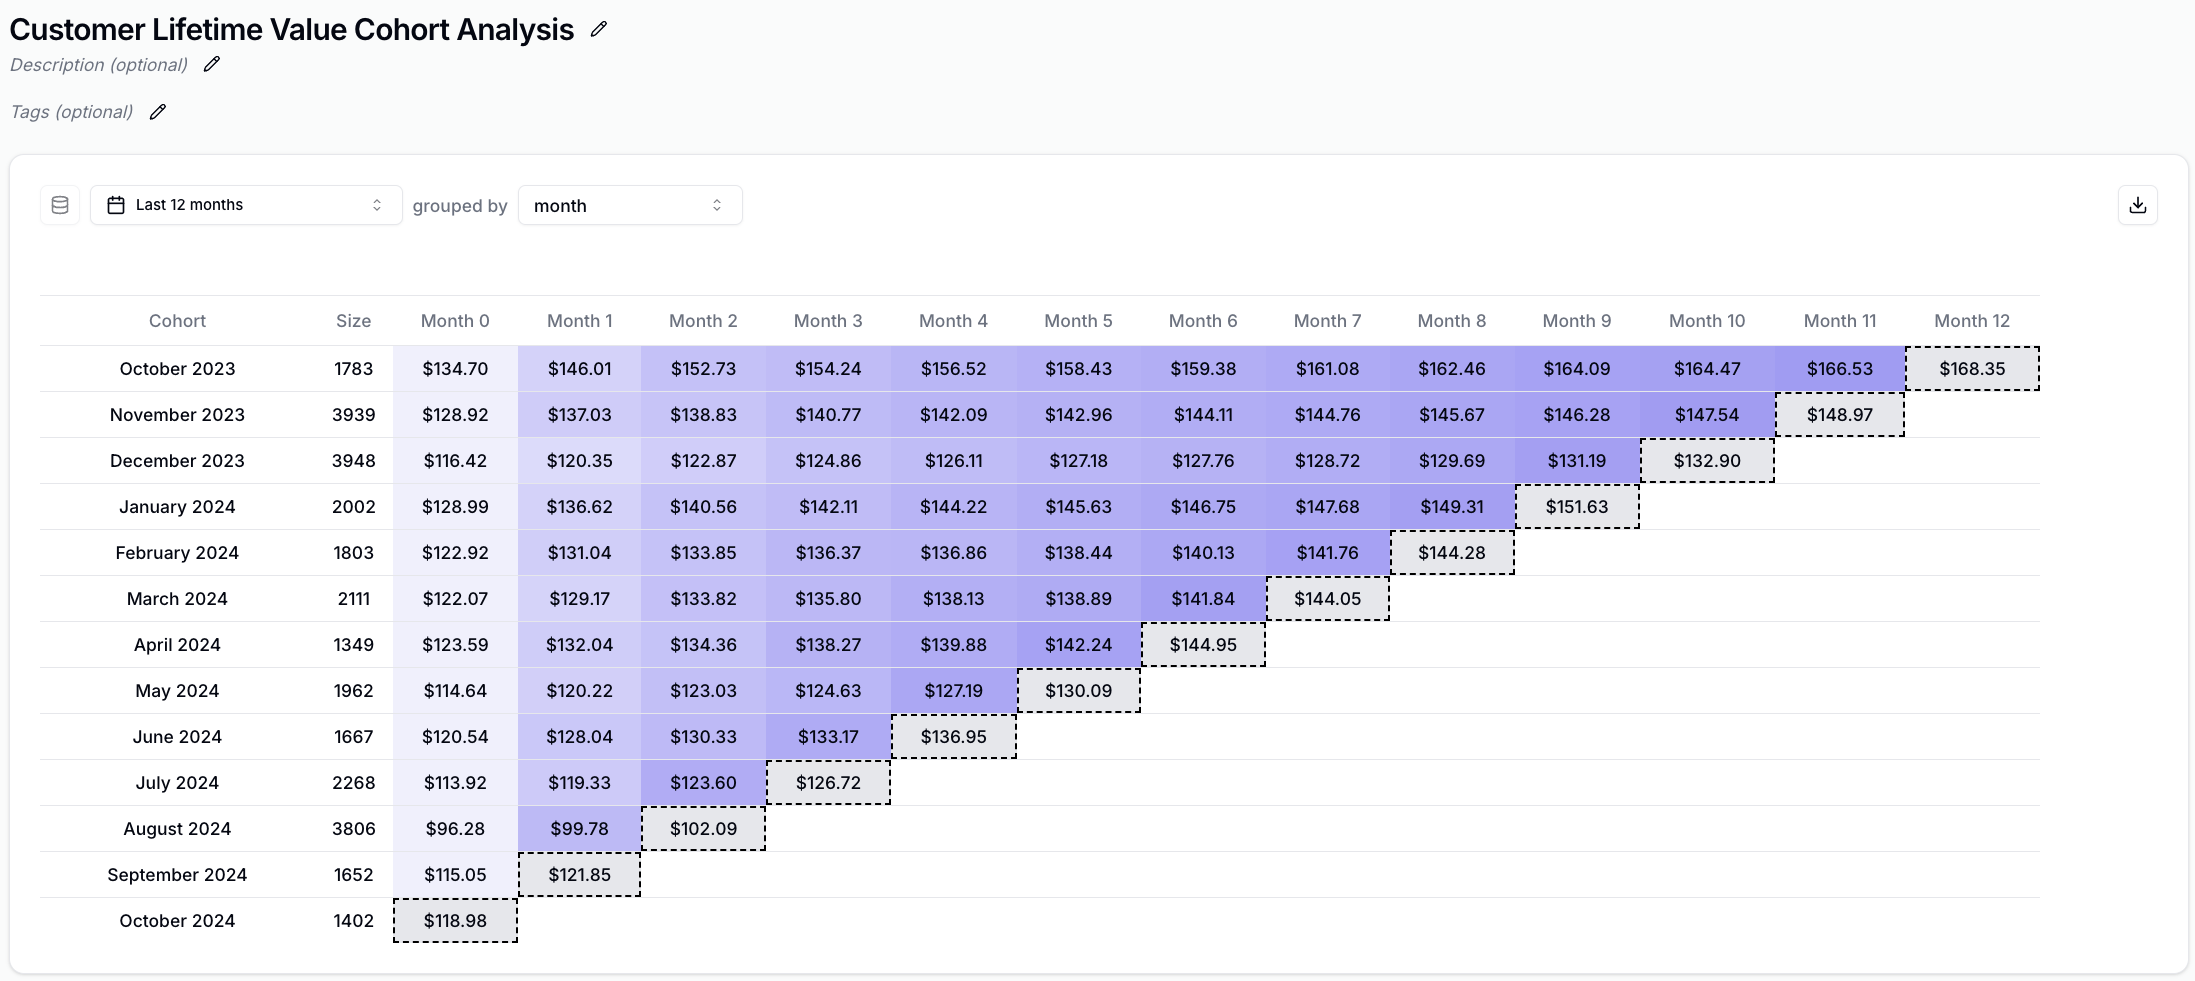 ## Cohort Metrics
| Metric | Description |
| -------------------------------------------------------- | ------------------------------------------------------- |
|
## Cohort Metrics
| Metric | Description |
| -------------------------------------------------------- | ------------------------------------------------------- |
|