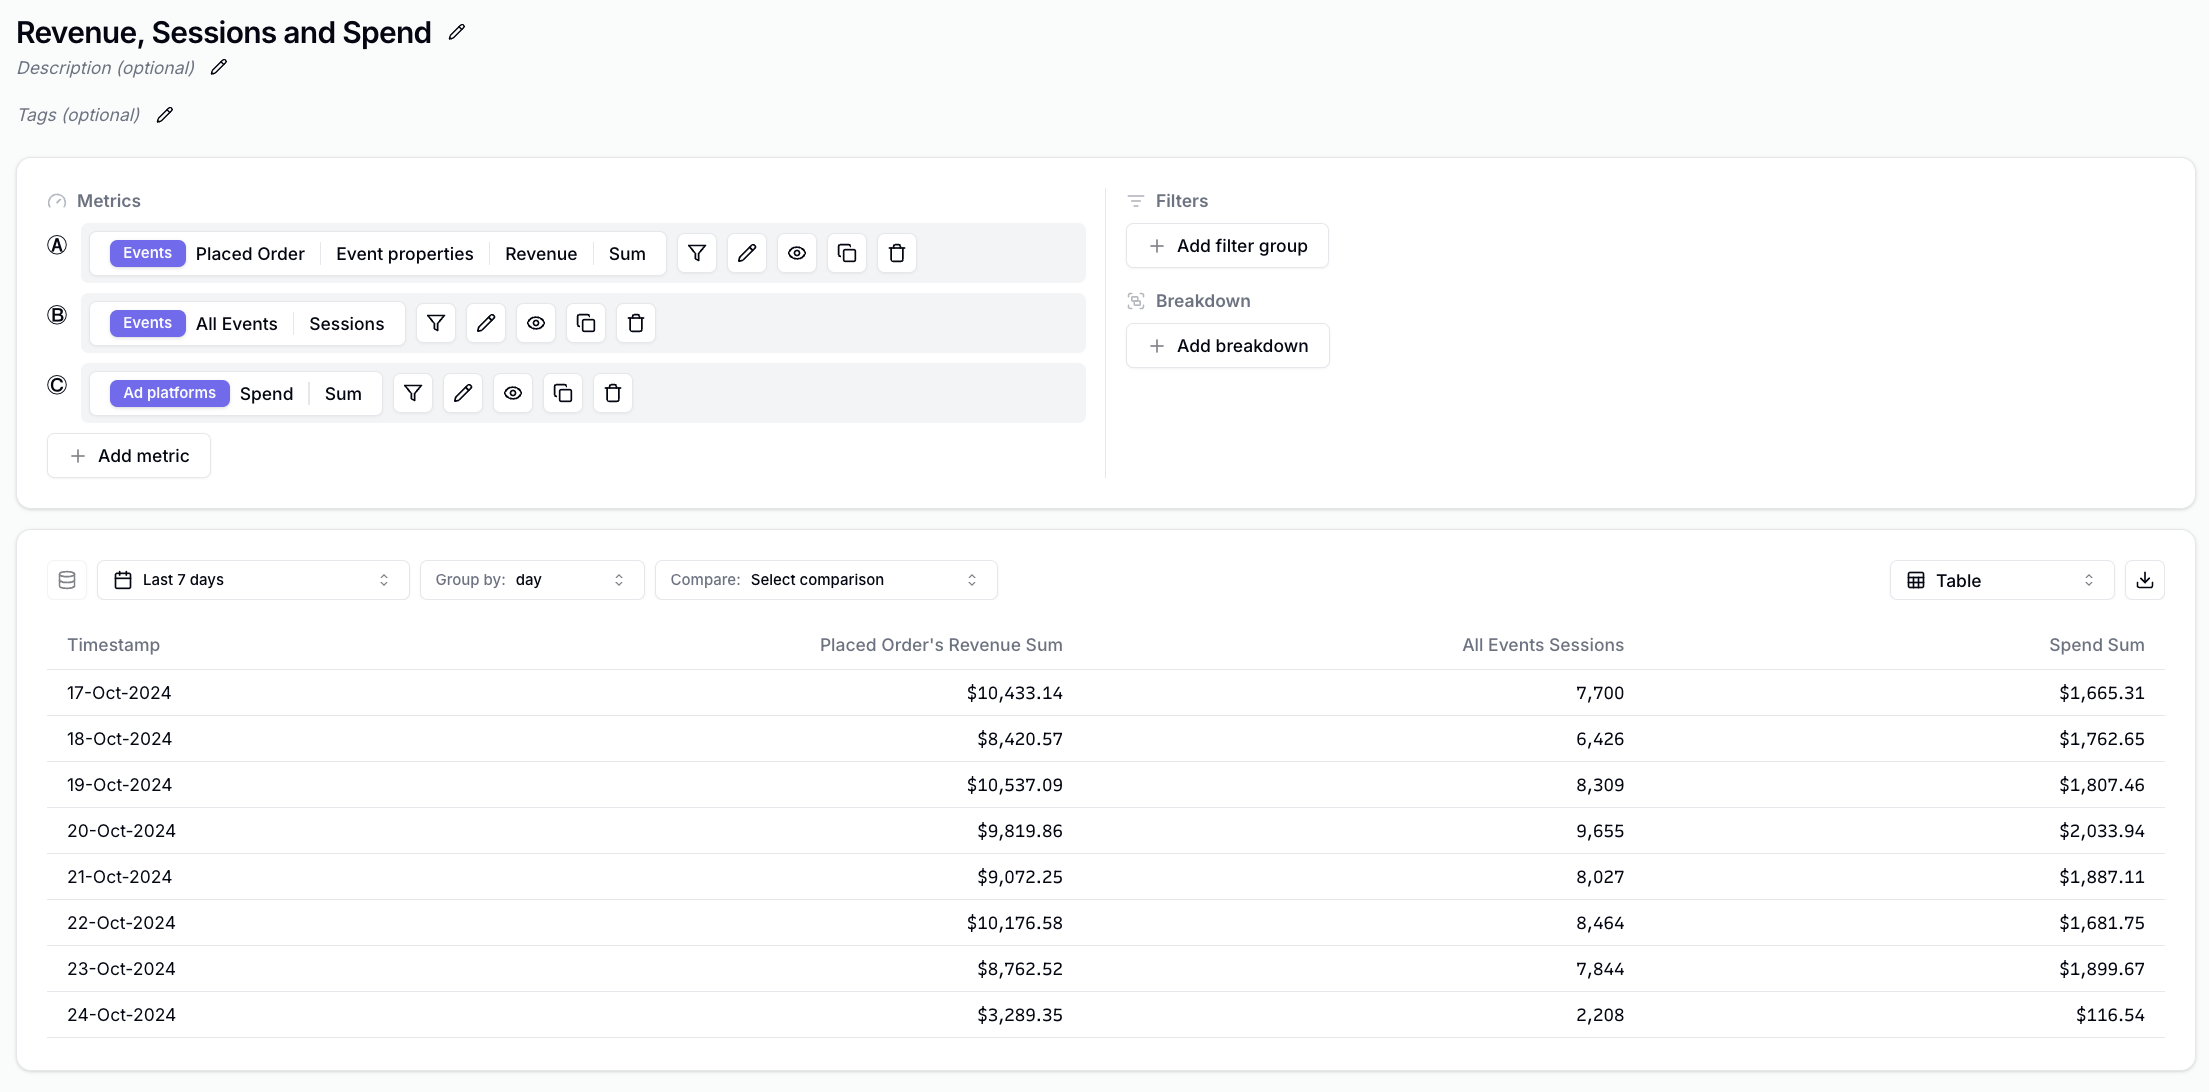
 ## Types of Metrics
When you click on **Add metric**, you have metrics in 4 categories.
### Popular
A small curated set of metrics from the other types that are often searched for.
## Types of Metrics
When you click on **Add metric**, you have metrics in 4 categories.
### Popular
A small curated set of metrics from the other types that are often searched for.
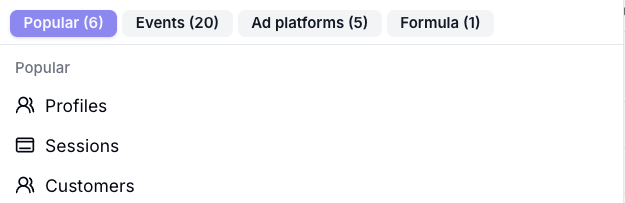 ### Events
Metrics based on the Events you track with the Converge [Sources](/sources/source-concepts)
### Events
Metrics based on the Events you track with the Converge [Sources](/sources/source-concepts)
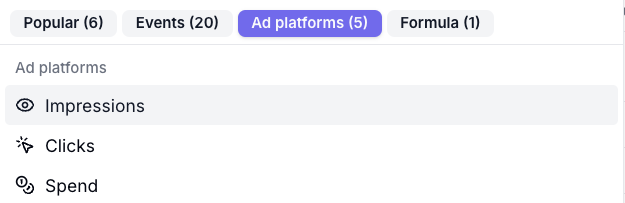
 ### Ad platforms
Metrics based on the Marketing Sources you connected under [Marketing Sources](/ad-platforms/overview)
### Ad platforms
Metrics based on the Marketing Sources you connected under [Marketing Sources](/ad-platforms/overview)
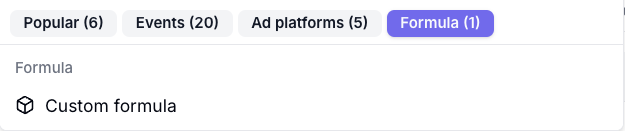
 ### Formula
A custom formula based on existing metrics.
### Formula
A custom formula based on existing metrics.
 ## Aggregations
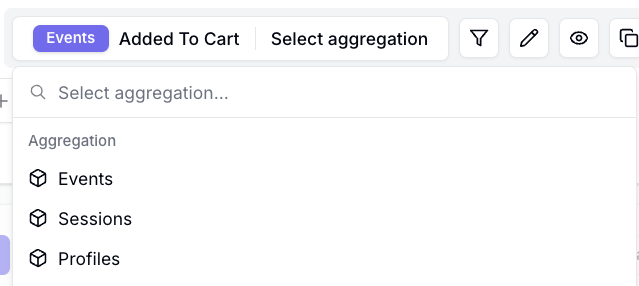
When you select Event Metrics such as **Added To Cart**, you might be looking for:
* The total number of **Added To Cart** events
* The total sessions with an **Added To Cart** event
* The **Added To Cart** conversion rate
* The Cost per **Added To Cart**
* etc.
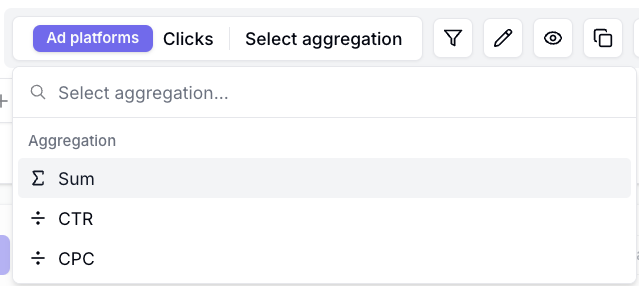
Similarly, if you select Ad Platform Metrics such as **Clicks**, you might be looking for:
* The total number of **Clicks**
* The **CTR**
* The **CPM**
* etc.
These different ways of counting the underlying event or ad platform metric are called **Aggregations**.
Every time you pick a metric, you will need to choose an aggregation as well.
### Available Event Aggregations
## Aggregations
When you select Event Metrics such as **Added To Cart**, you might be looking for:
* The total number of **Added To Cart** events
* The total sessions with an **Added To Cart** event
* The **Added To Cart** conversion rate
* The Cost per **Added To Cart**
* etc.
Similarly, if you select Ad Platform Metrics such as **Clicks**, you might be looking for:
* The total number of **Clicks**
* The **CTR**
* The **CPM**
* etc.
These different ways of counting the underlying event or ad platform metric are called **Aggregations**.
Every time you pick a metric, you will need to choose an aggregation as well.
### Available Event Aggregations
 | Aggregation | Description |
| --------------------------- | ----------------------------------------------------------------------------------------------------------------------------------------- |
| **Events** | Total number of times an event occurred over the chosen period |
| **Sessions** | Total number of sessions with the specified event occurring at least once over the chosen period |
| **Profiles** | Total number of profiles who triggered the specified event at least once over the chosen period |
| **Session conversion rate** | Total number of sessions with the specified event occurring at least once divided by total sessions over the chosen period |
| **Profile conversion rate** | Total number of profiles with the specified event occurring at least once divided by total profiles with a Session over the chosen period |
| **CPA** | CPA of the chosen event. Without a specific Channel filter, this is equal to the **Blended CPA** |
| **ROAS** | ROAS of the chosen event. Without a specific Channel filter, this is equal to the **Blended ROAS** |
| **Event Properties** | Allows you to do an aggregation of a specific event property |
### Available Ad Platform Aggregations
| Aggregation | Description |
| --------------------------- | ----------------------------------------------------------------------------------------------------------------------------------------- |
| **Events** | Total number of times an event occurred over the chosen period |
| **Sessions** | Total number of sessions with the specified event occurring at least once over the chosen period |
| **Profiles** | Total number of profiles who triggered the specified event at least once over the chosen period |
| **Session conversion rate** | Total number of sessions with the specified event occurring at least once divided by total sessions over the chosen period |
| **Profile conversion rate** | Total number of profiles with the specified event occurring at least once divided by total profiles with a Session over the chosen period |
| **CPA** | CPA of the chosen event. Without a specific Channel filter, this is equal to the **Blended CPA** |
| **ROAS** | ROAS of the chosen event. Without a specific Channel filter, this is equal to the **Blended ROAS** |
| **Event Properties** | Allows you to do an aggregation of a specific event property |
### Available Ad Platform Aggregations
 | Metric | Aggregation | Description |
| --------------------------------------------------------------- | ----------- | ------------------------------------------ |
|
| Metric | Aggregation | Description |
| --------------------------------------------------------------- | ----------- | ------------------------------------------ |
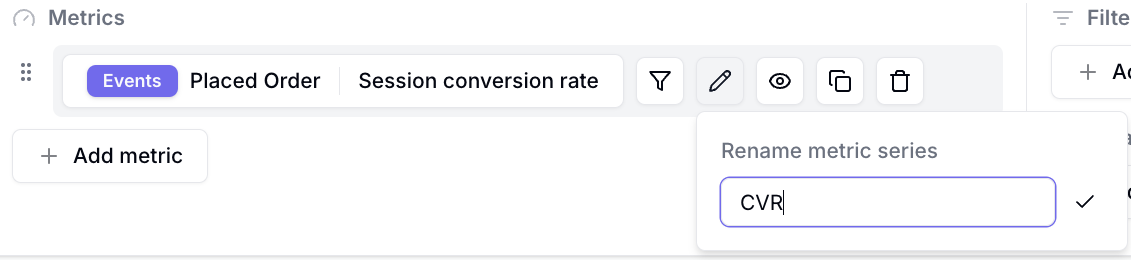
|  2. Give your metric a new name and click on
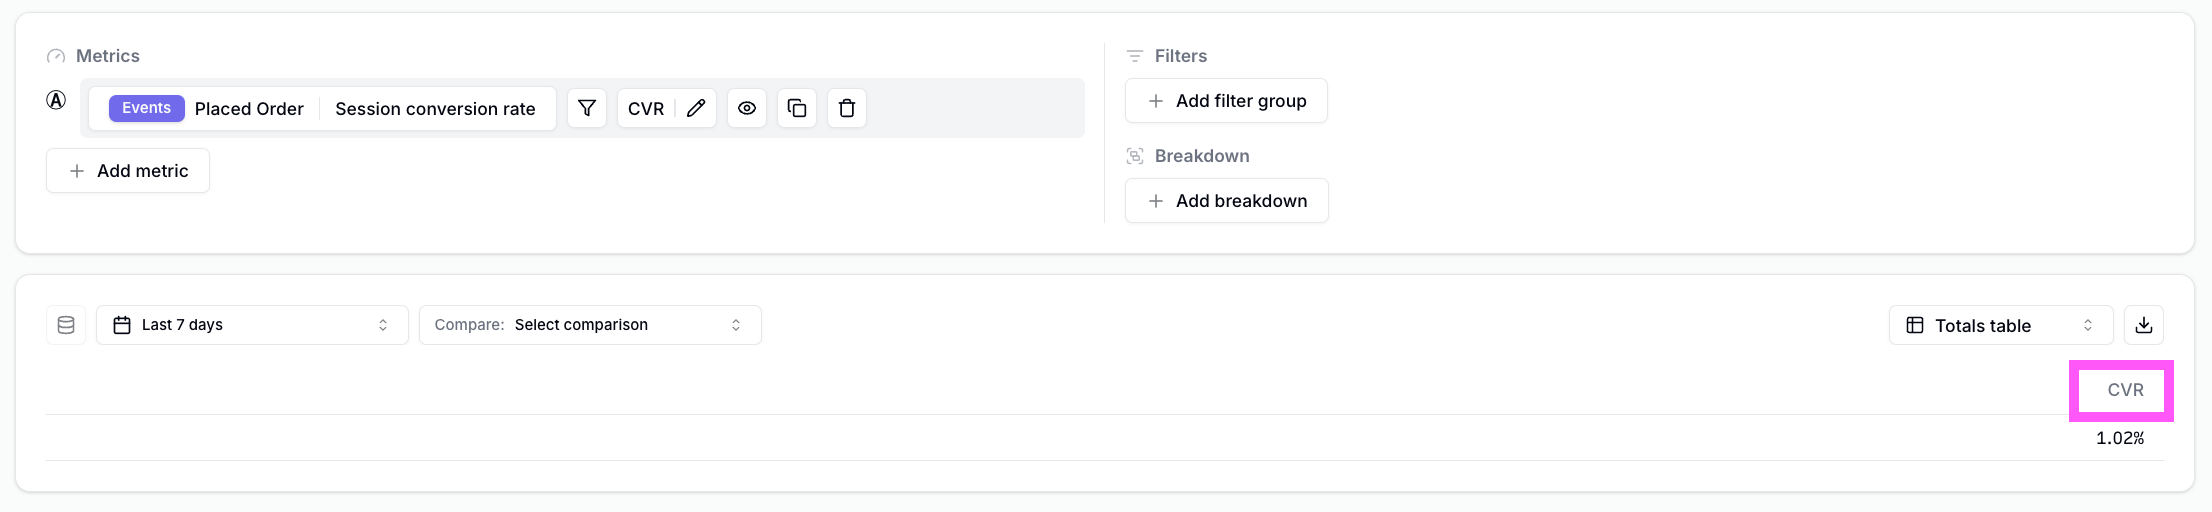
  3. Notice that in your insight, the metric is appropriately renamed
 ## Hiding a Metric
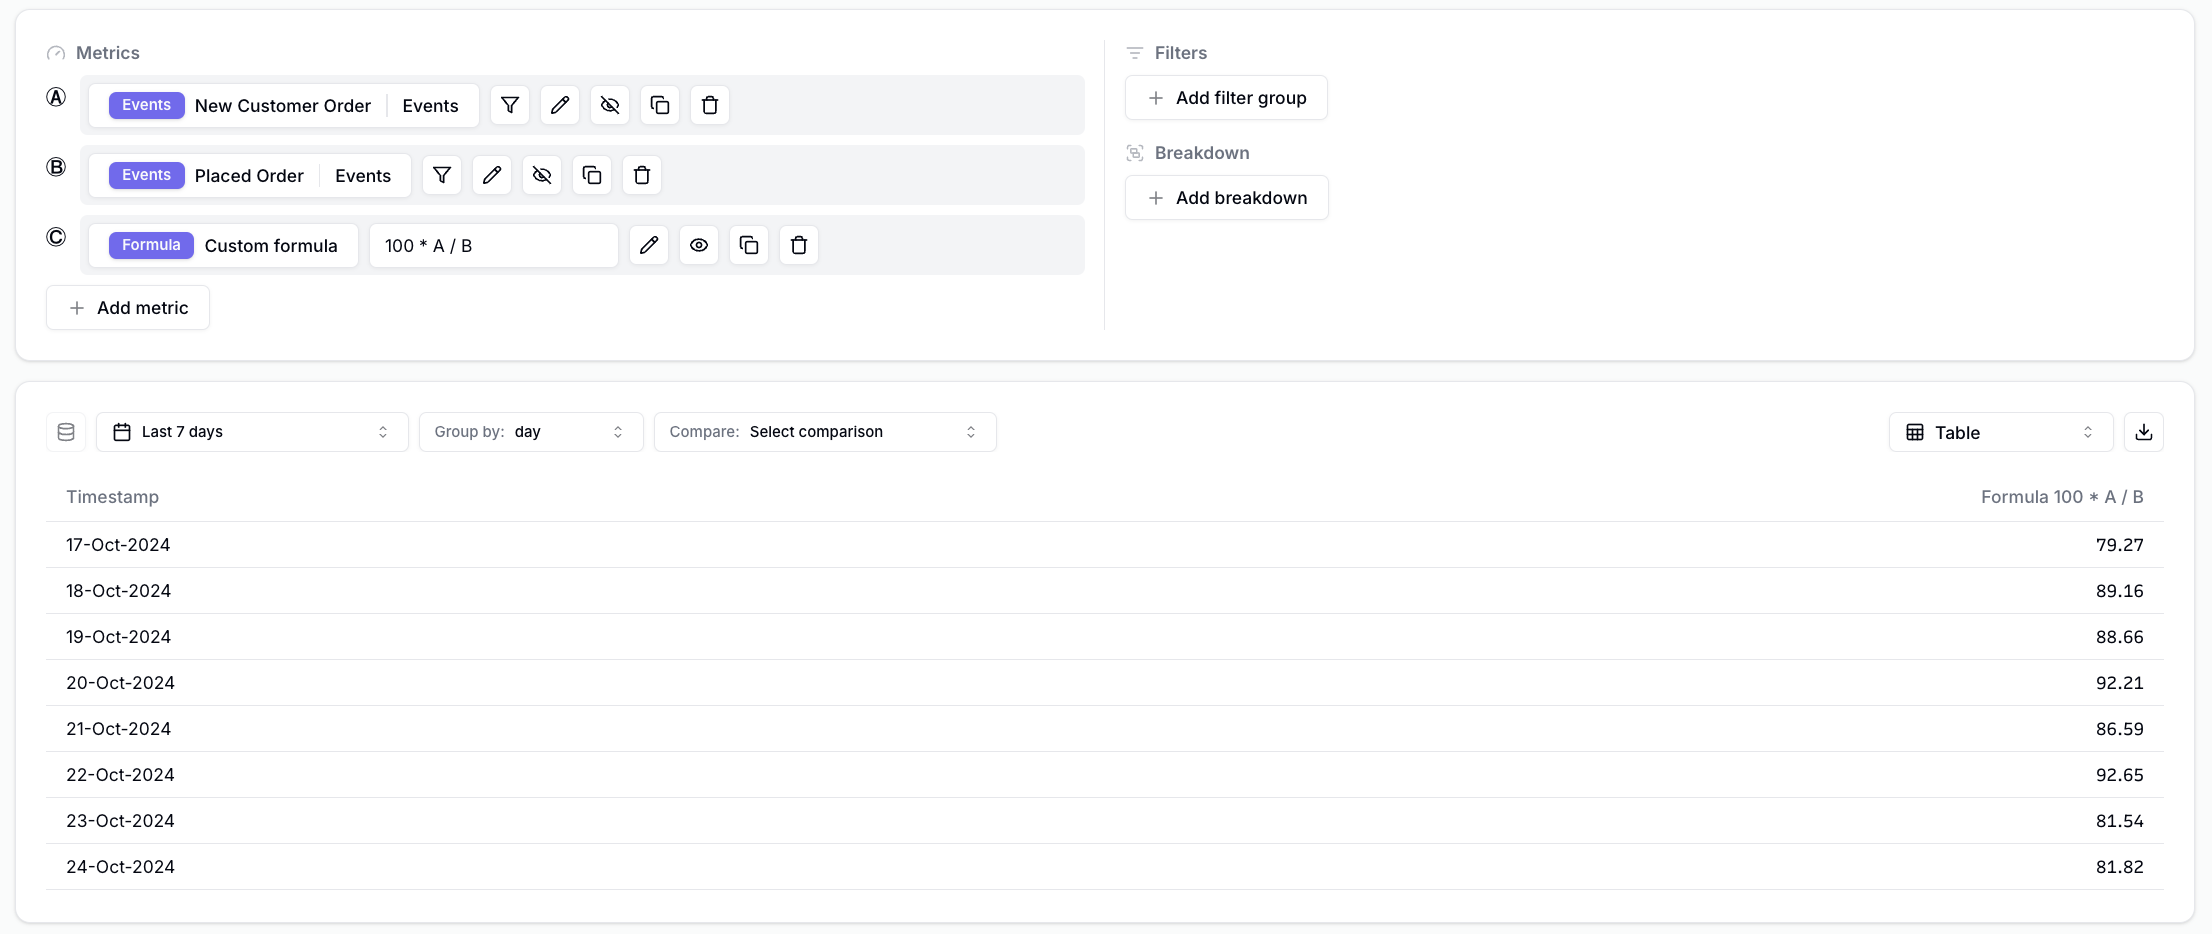
You might want to combine some metrics in Formula Mode and only show a subset of the metrics you've used in the query.
For example, say that we want to show the **New Customer %**, which is defined as `100% * New Customers / Total Orders`.
The query would look something like this.
## Hiding a Metric
You might want to combine some metrics in Formula Mode and only show a subset of the metrics you've used in the query.
For example, say that we want to show the **New Customer %**, which is defined as `100% * New Customers / Total Orders`.
The query would look something like this.
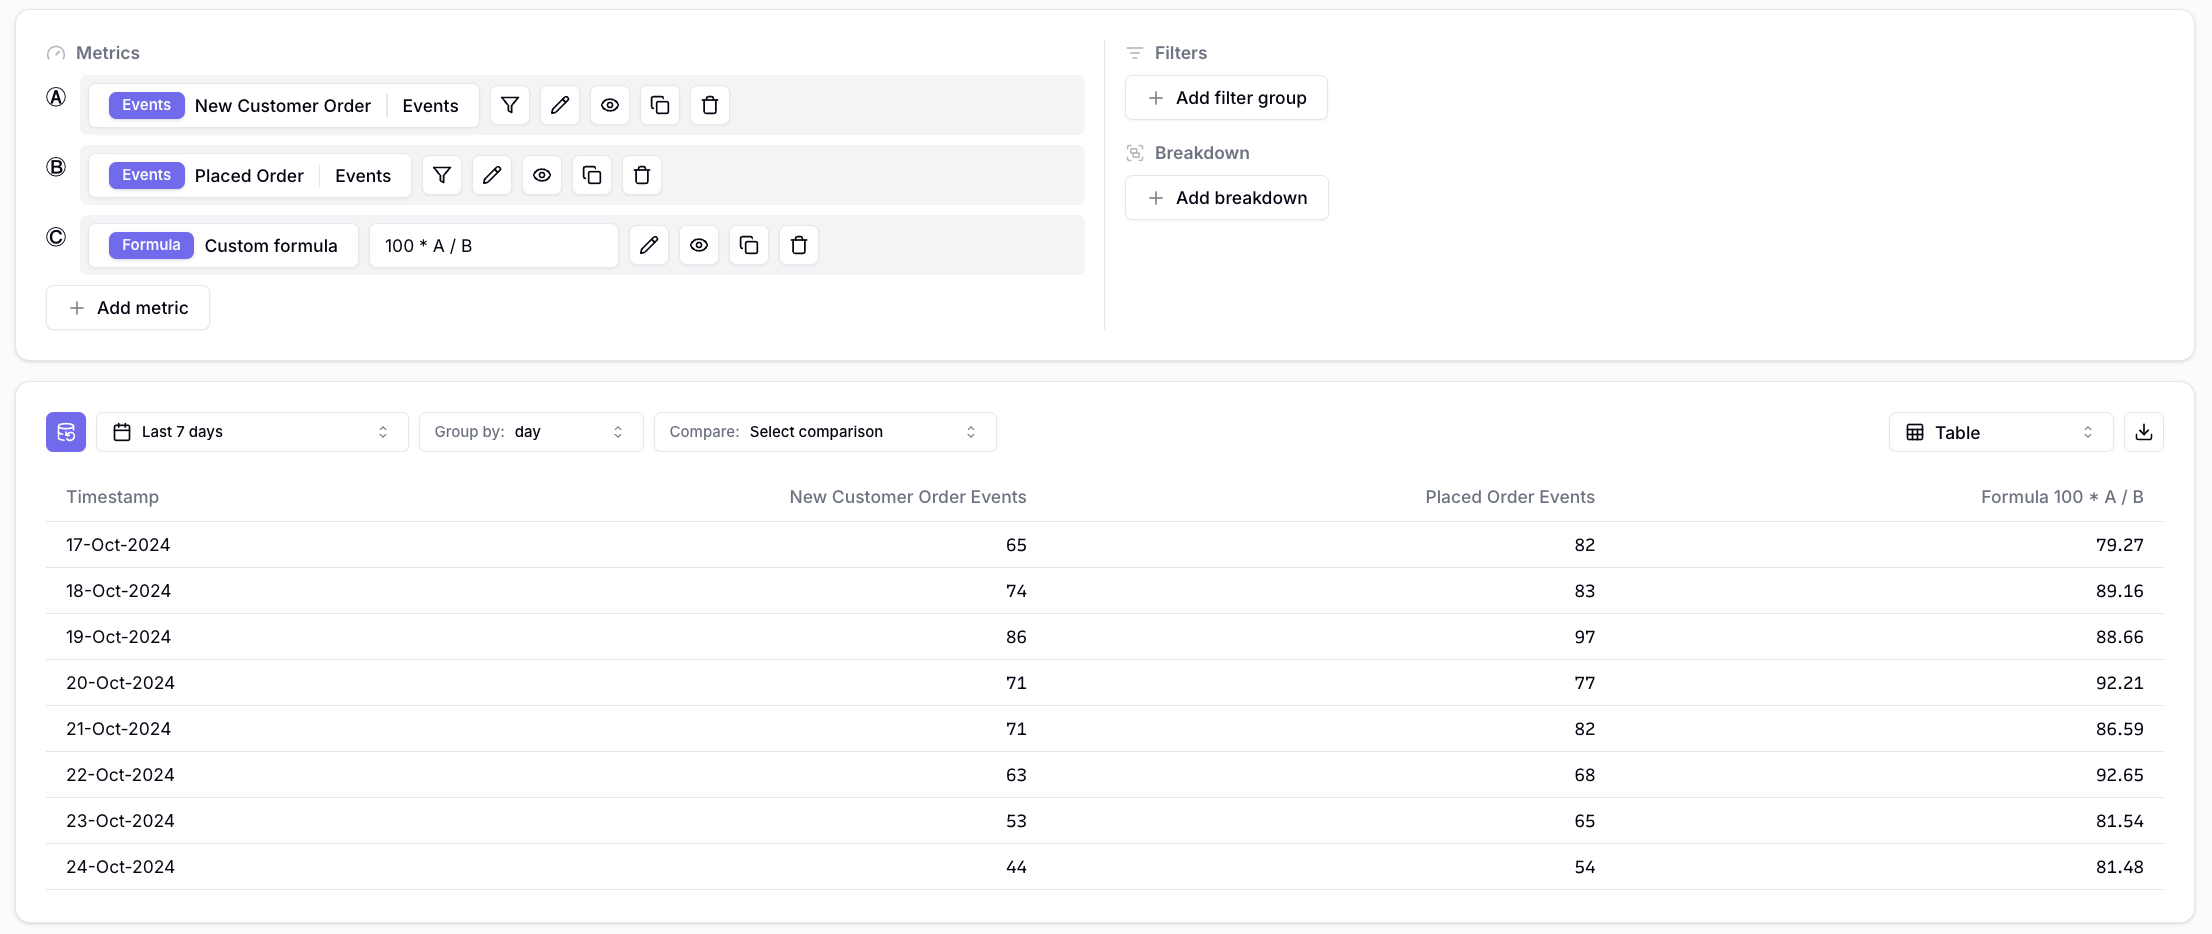 To make sure that the Insight only consists of Metric **C**, you can hide metrics A & B as follows:
1. Click on the
2. The metrics should have disappeared from the insight.
To make sure that the Insight only consists of Metric **C**, you can hide metrics A & B as follows:
1. Click on the
2. The metrics should have disappeared from the insight.