> ## Documentation Index
> Fetch the complete documentation index at: https://docs.runconverge.com/llms.txt
> Use this file to discover all available pages before exploring further.

# Visualization types

export const Icon = ({name}) => {
  return <div className="h-4 w-4 fill-gray-800 dark:fill-gray-100 text-gray-800 dark:text-gray-100 inline-block align-middle">
            <svg className="w-4 h-4 bg-gray-800 dark:bg-gray-100" style={{
    maskImage: `url('https://mintlify.b-cdn.net/v6.5.1/solid/${name}.svg')`,
    maskRepeat: "no-repeat",
    maskPosition: "center center"
  }} />
        </div>;
};

export const IconText = ({name, text, iconSource = "mintlify", iconLocation = "before", iconType = "solid"}) => {
  const sourceUrl = iconSource === 'local' ? `url('/images/icons/${name}.svg')` : `url('https://mintlify.b-cdn.net/v6.5.1/${iconType}/${name}.svg')`;
  return <>
            <div className="inline-block pl-2">
                {iconLocation === 'before' && <div className="h-3.5 w-3.5 fill-gray-800 dark:fill-gray-100 text-gray-800 dark:text-gray-100 inline-block align-middle mr-2">
                        <svg className="w-4 h-4 bg-gray-800 dark:bg-gray-100 " style={{
    maskImage: sourceUrl,
    maskRepeat: "no-repeat",
    maskPosition: "center center"
  }} />
                    </div>}
                <span className="inline-block align-middle font-semibold fill-gray-800 dark:fill-gray-100 text-gray-800 dark:text-gray-100 pl-1 pr-2">{text}</span>
                {iconLocation === 'after' && <div className="h-3.5 w-3.5 fill-gray-800 dark:fill-gray-100 text-gray-800 dark:text-gray-100 inline-block align-middle mr-2">
                        <svg className="w-4 h-4 bg-gray-800 dark:bg-gray-100 pr-3" style={{
    maskImage: sourceUrl,
    maskRepeat: "no-repeat",
    maskPosition: "center center"
  }} />
                    </div>}
            </div>
        </>;
};

Visualization Types allow you to showcase the same queries in different ways.
There are two categories of Visualization Types: **Time series** and **Total values**.

Within a certain visualization type, you can choose different Visualization Options.

## Visualization Types

### Changing the Visualization Type

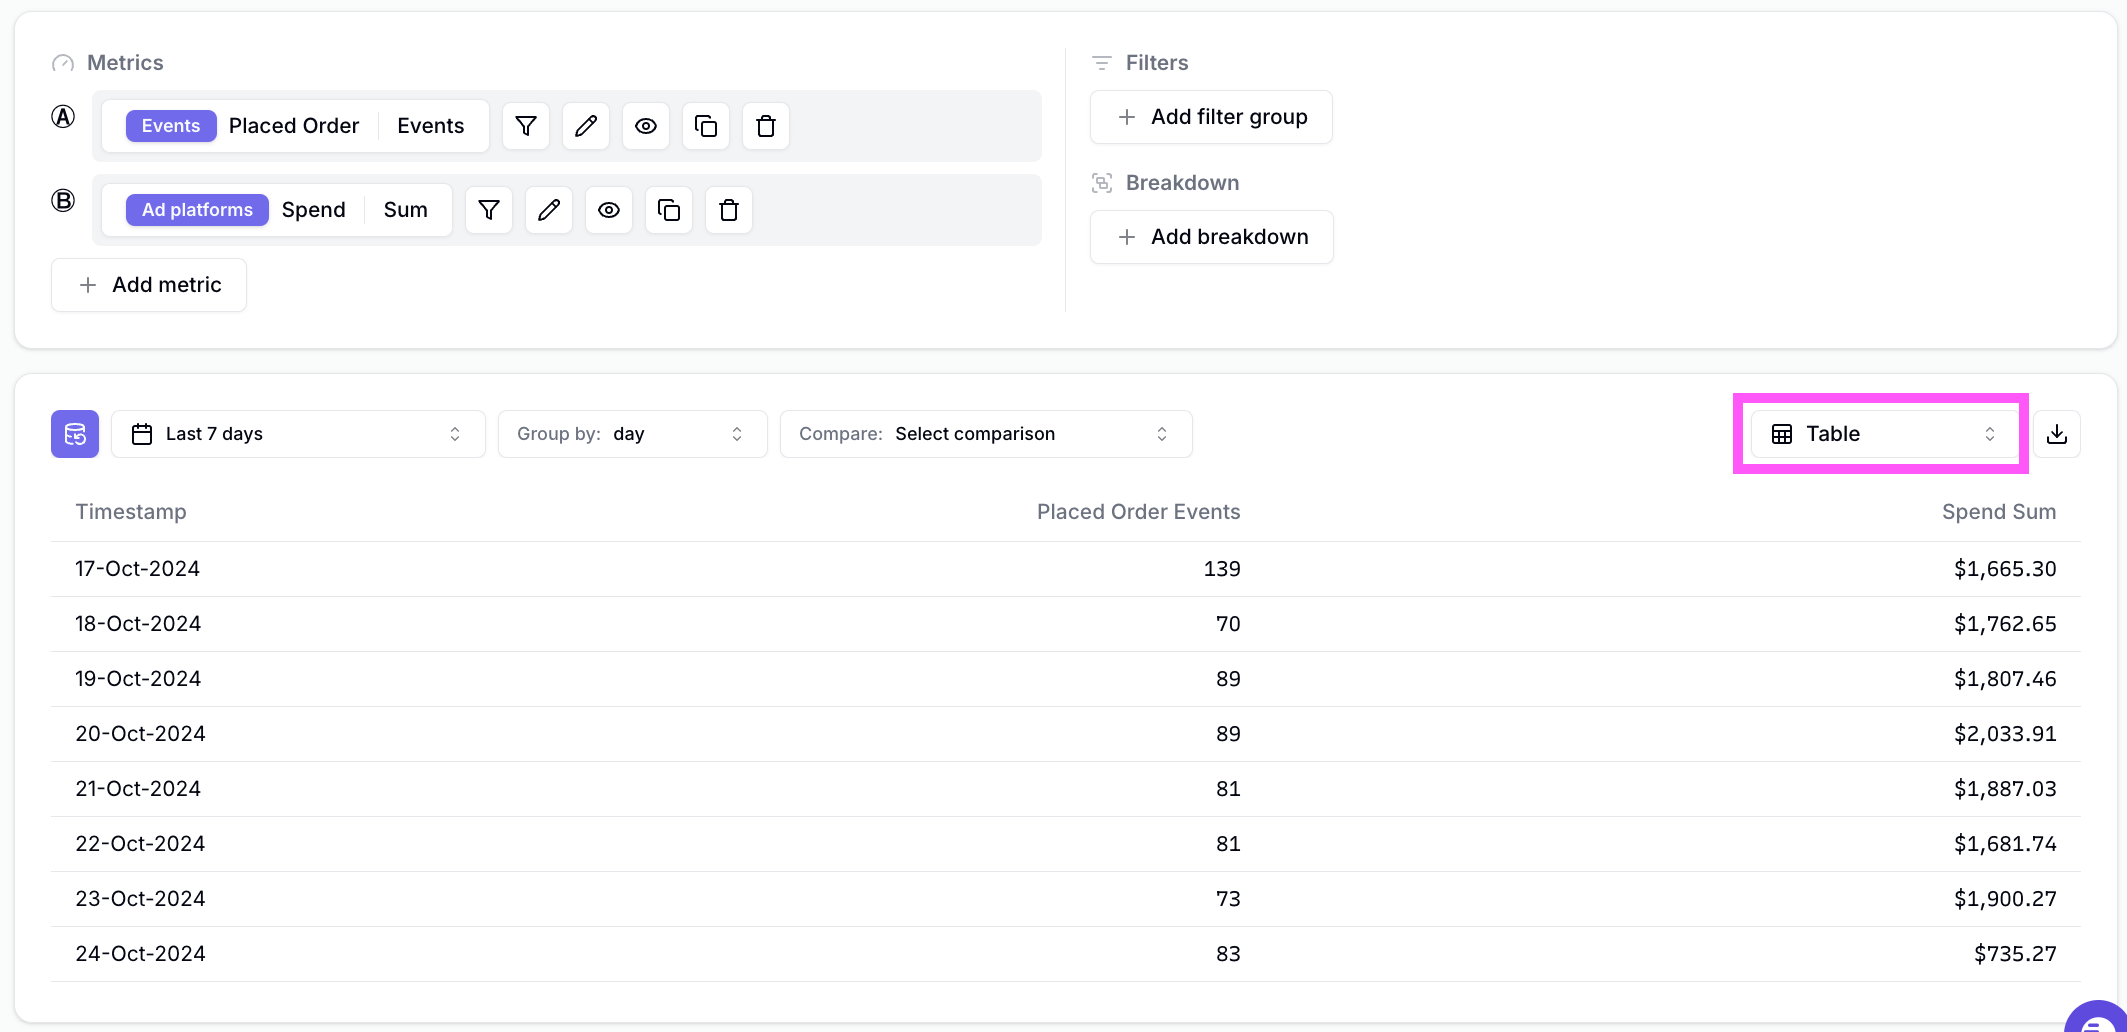
You can change the Visualization Type using the Visualization Type Picker as per the screenshot below:

<Frame>
  <img src="https://mintcdn.com/converge/ecGnucKsPgTlQzkL/images/insights-dashboards/visualization-type-picker.png?fit=max&auto=format&n=ecGnucKsPgTlQzkL&q=85&s=a255f64896d0804178ce0806d51e7a2e" alt="visualization-picker" width="2127" height="1032" data-path="images/insights-dashboards/visualization-type-picker.png" />
</Frame>

### Time series visualization types

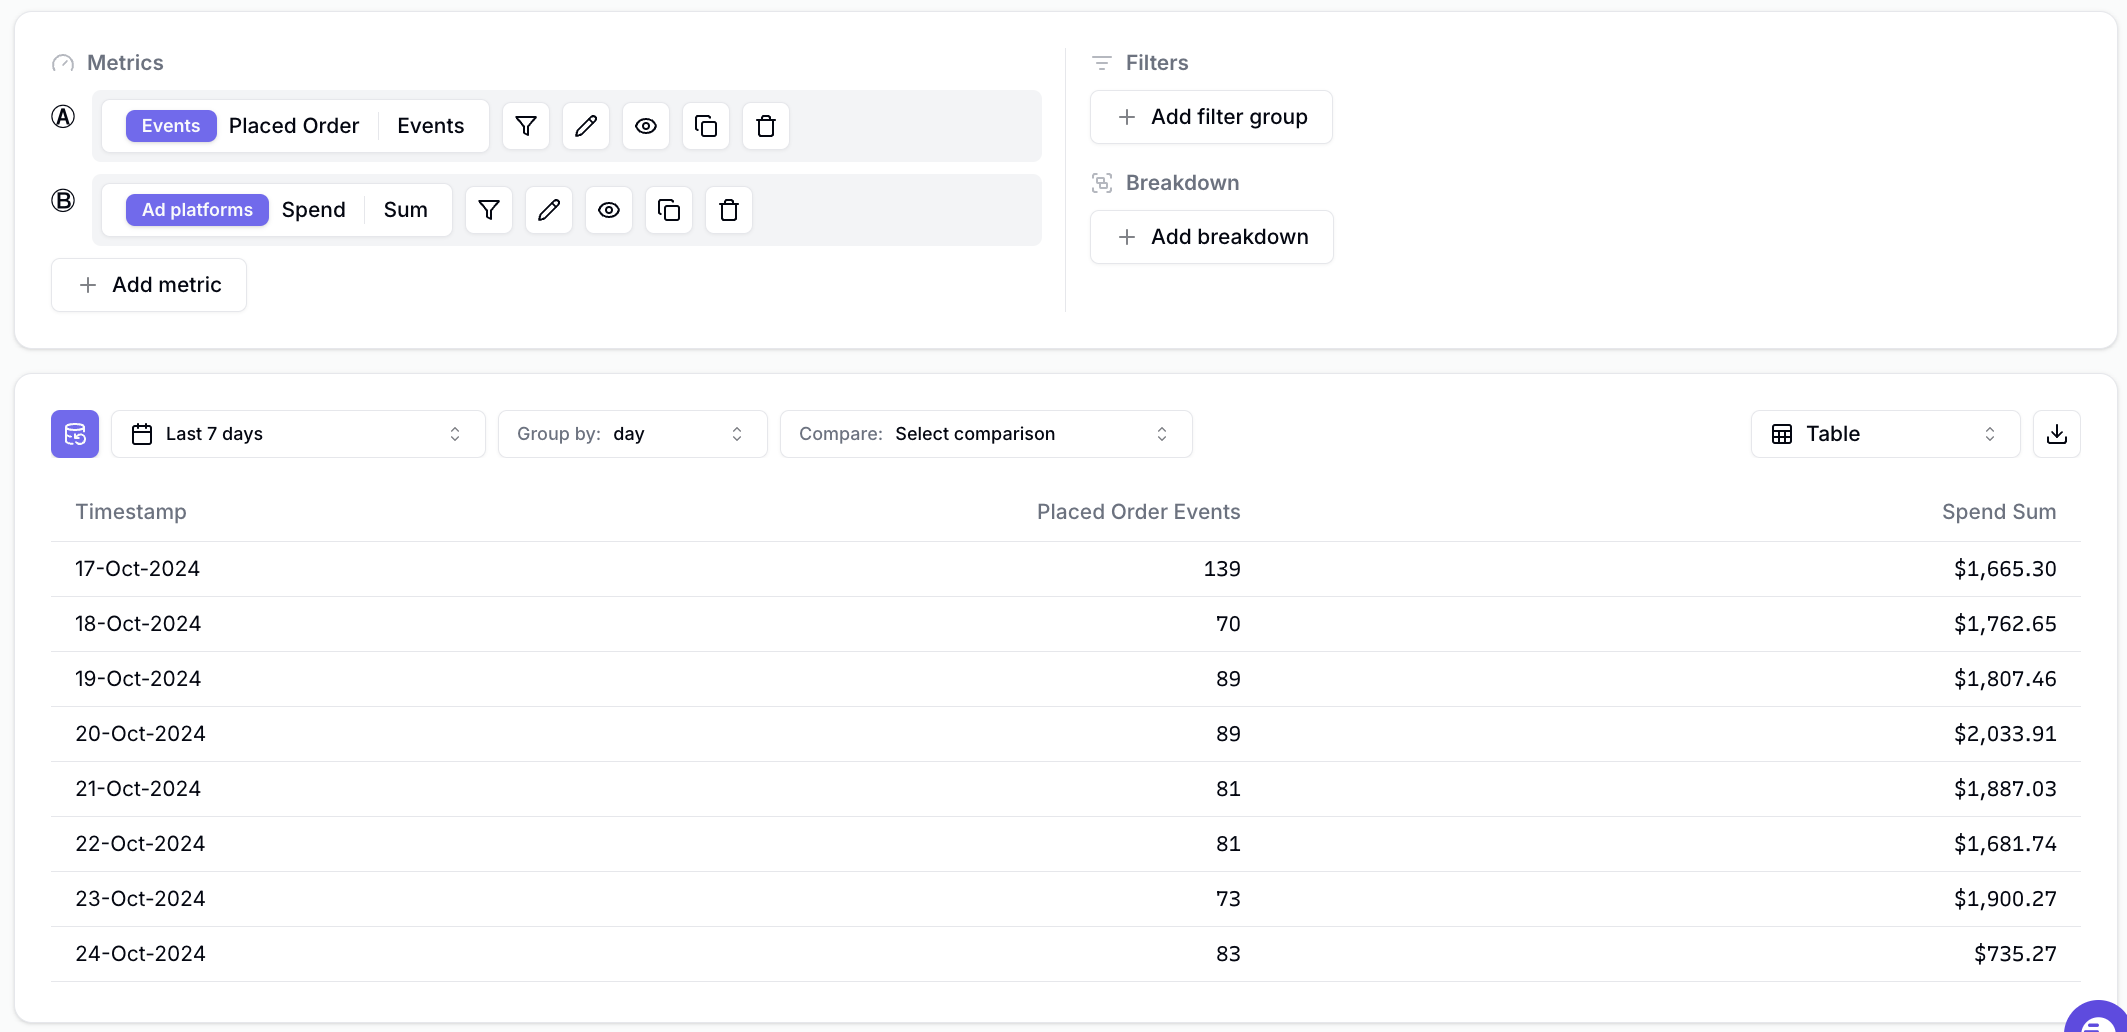
Time series Visualization types show you how metrics change over time.

#### Table
<Frame>
  <img src="https://mintcdn.com/converge/ecGnucKsPgTlQzkL/images/insights-dashboards/visualization-example-table.png?fit=max&auto=format&n=ecGnucKsPgTlQzkL&q=85&s=523a2d78358893c059890b579003cbf6" alt="three-metrics" width="2127" height="1032" data-path="images/insights-dashboards/visualization-example-table.png" />
</Frame>

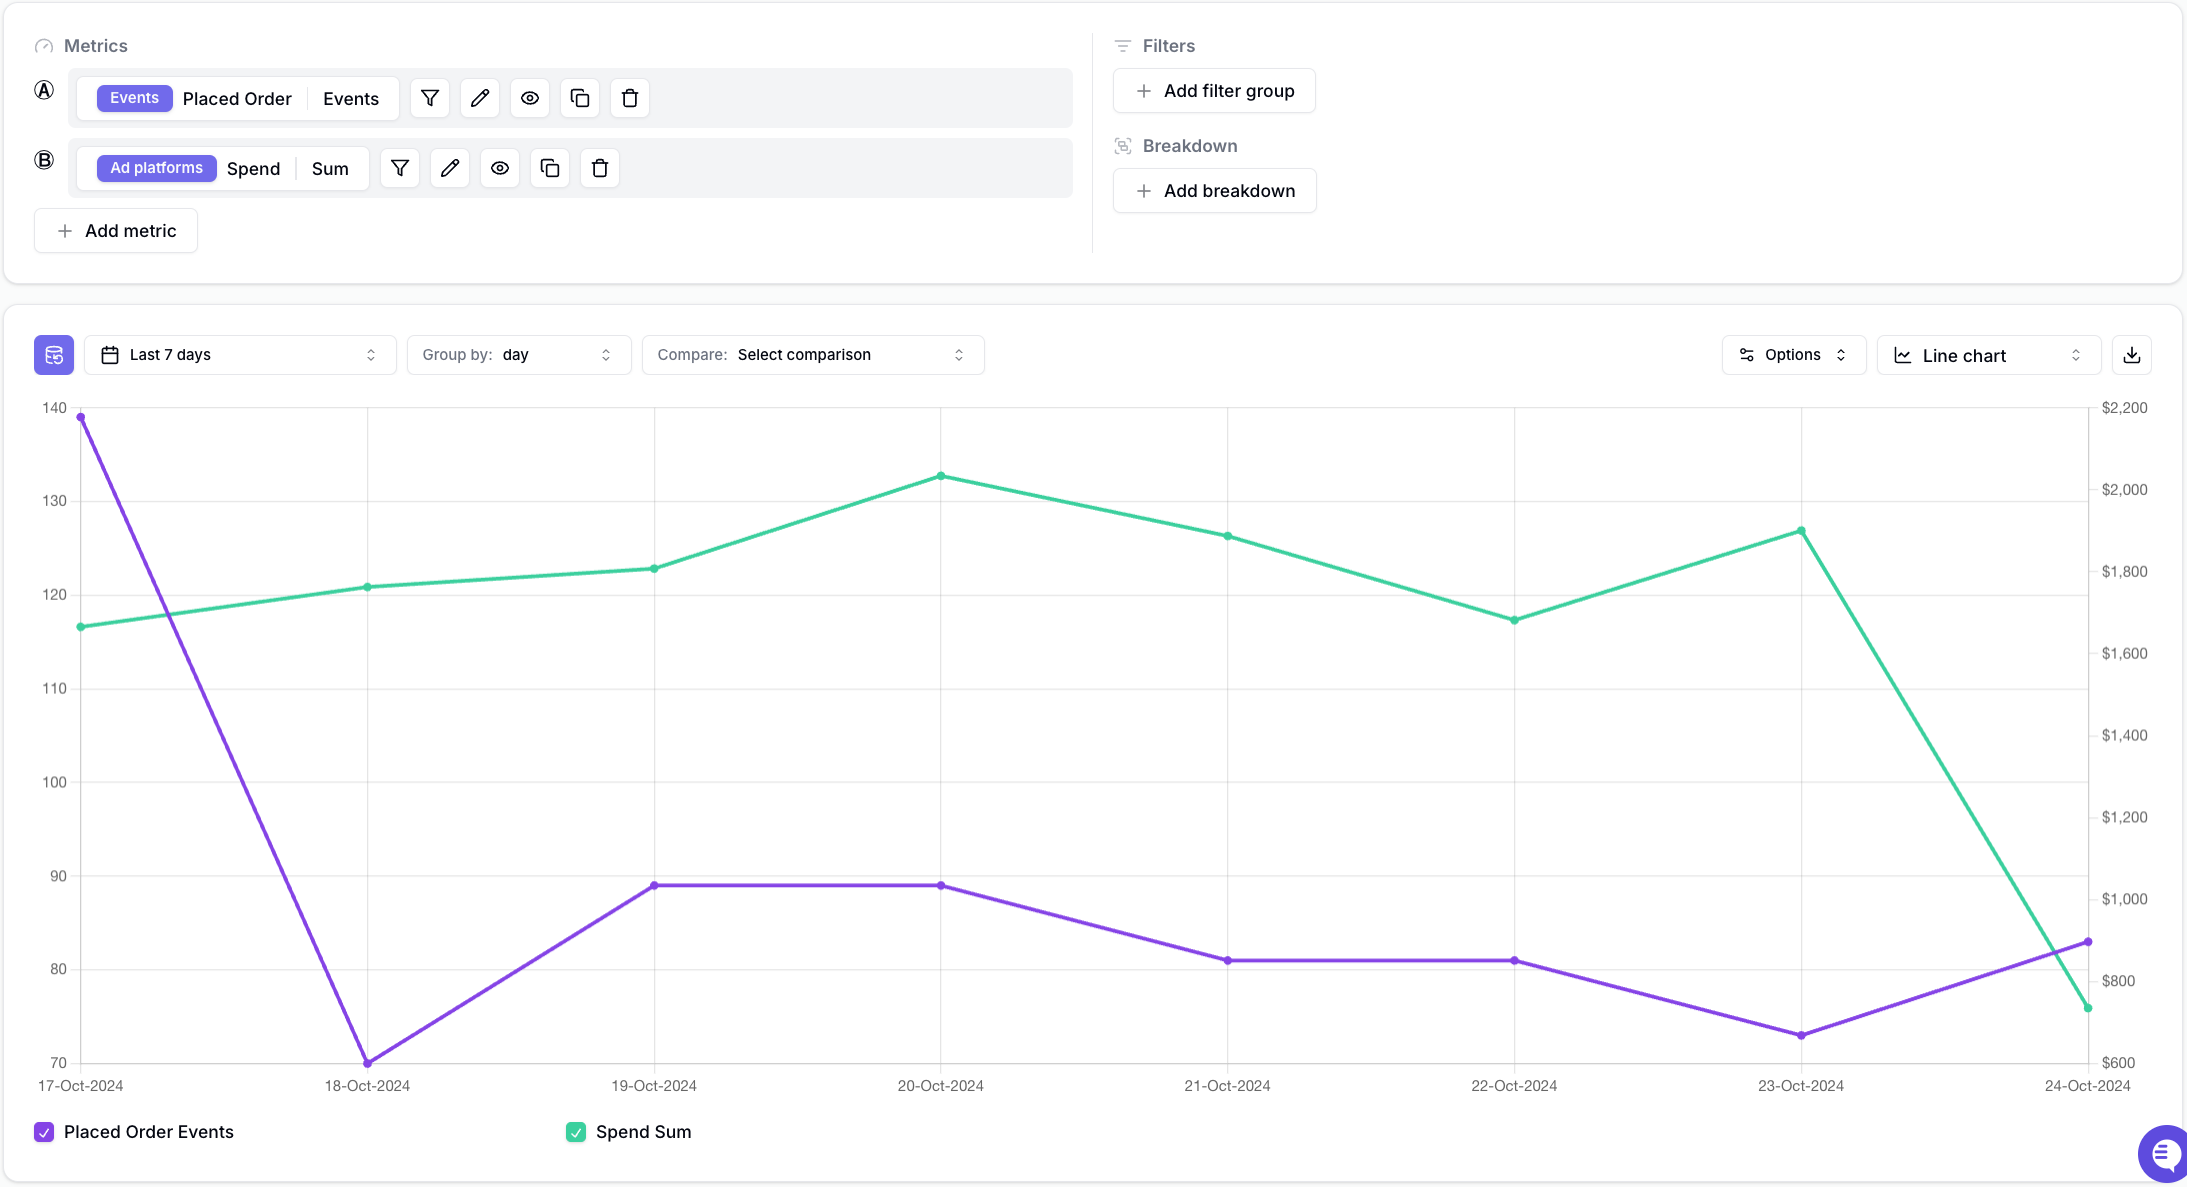
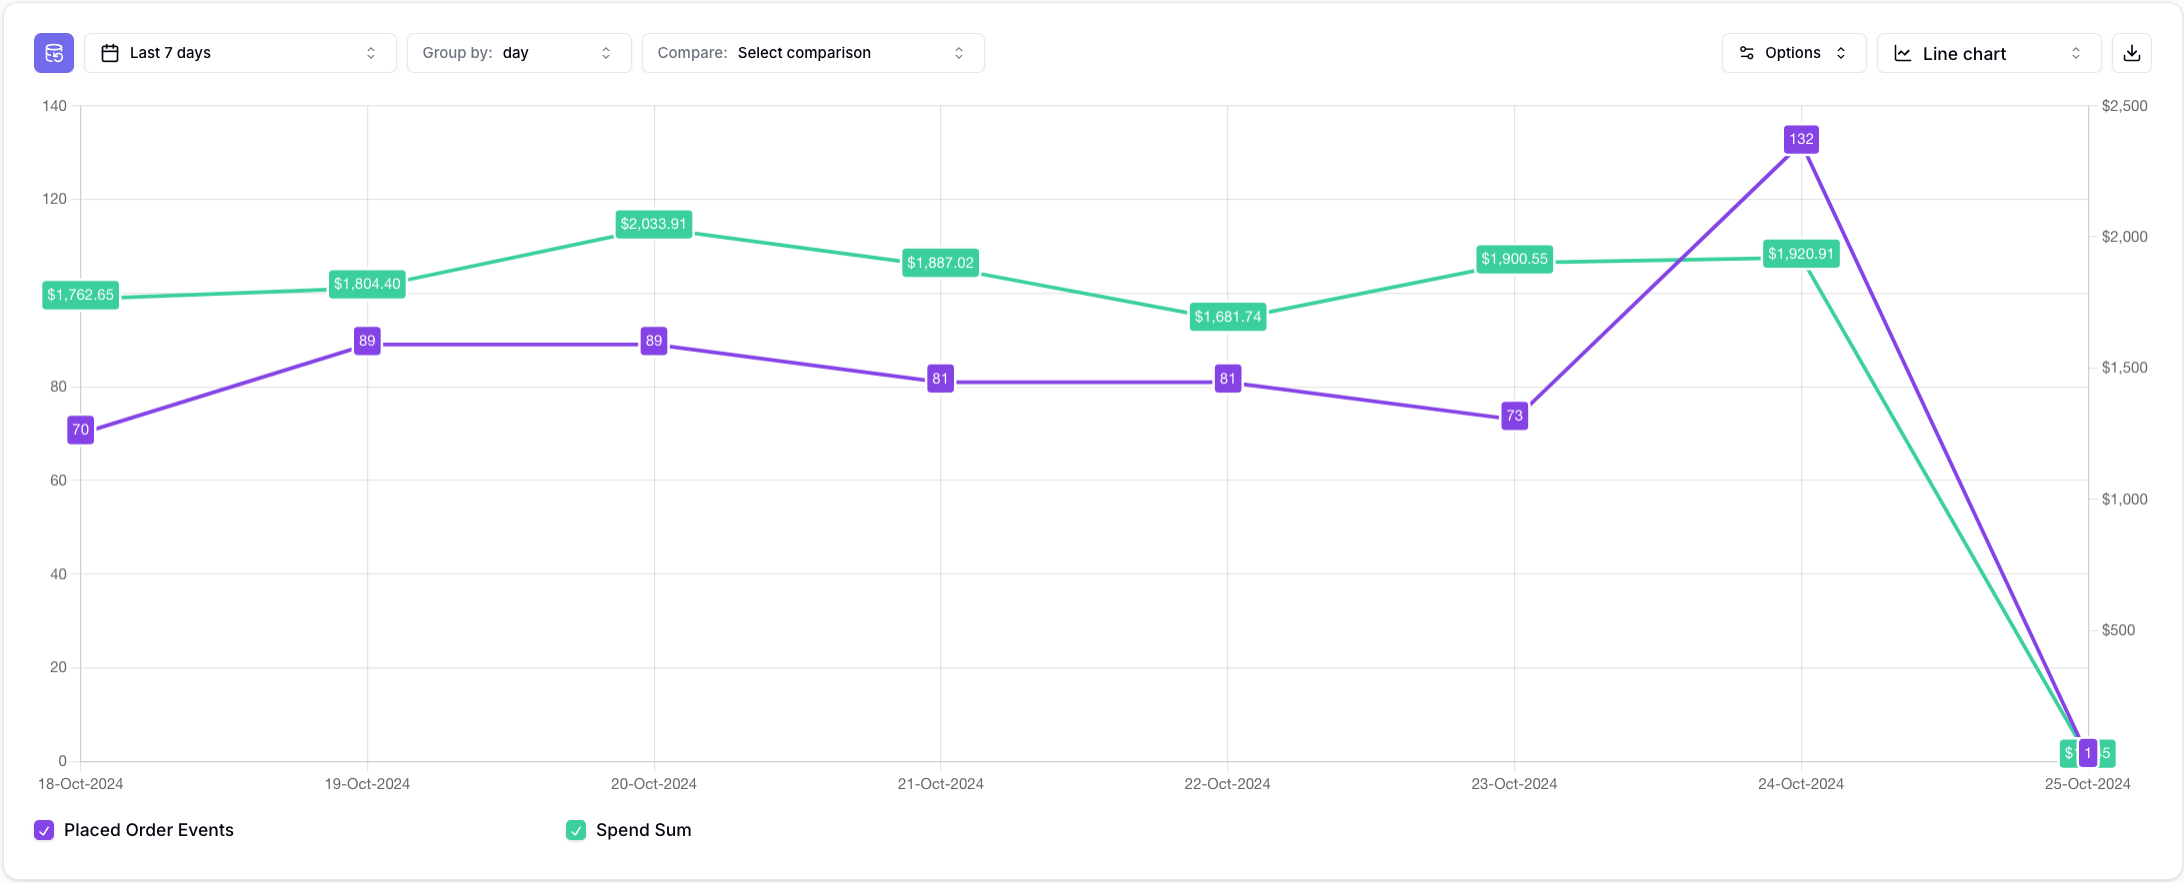
#### Line Chart

<Frame>
  <img src="https://mintcdn.com/converge/ecGnucKsPgTlQzkL/images/insights-dashboards/visualization-example-line-chart.png?fit=max&auto=format&n=ecGnucKsPgTlQzkL&q=85&s=62fa5770fe4423336eb1efd8e9461b82" alt="three-metrics" width="2187" height="1187" data-path="images/insights-dashboards/visualization-example-line-chart.png" />
</Frame>

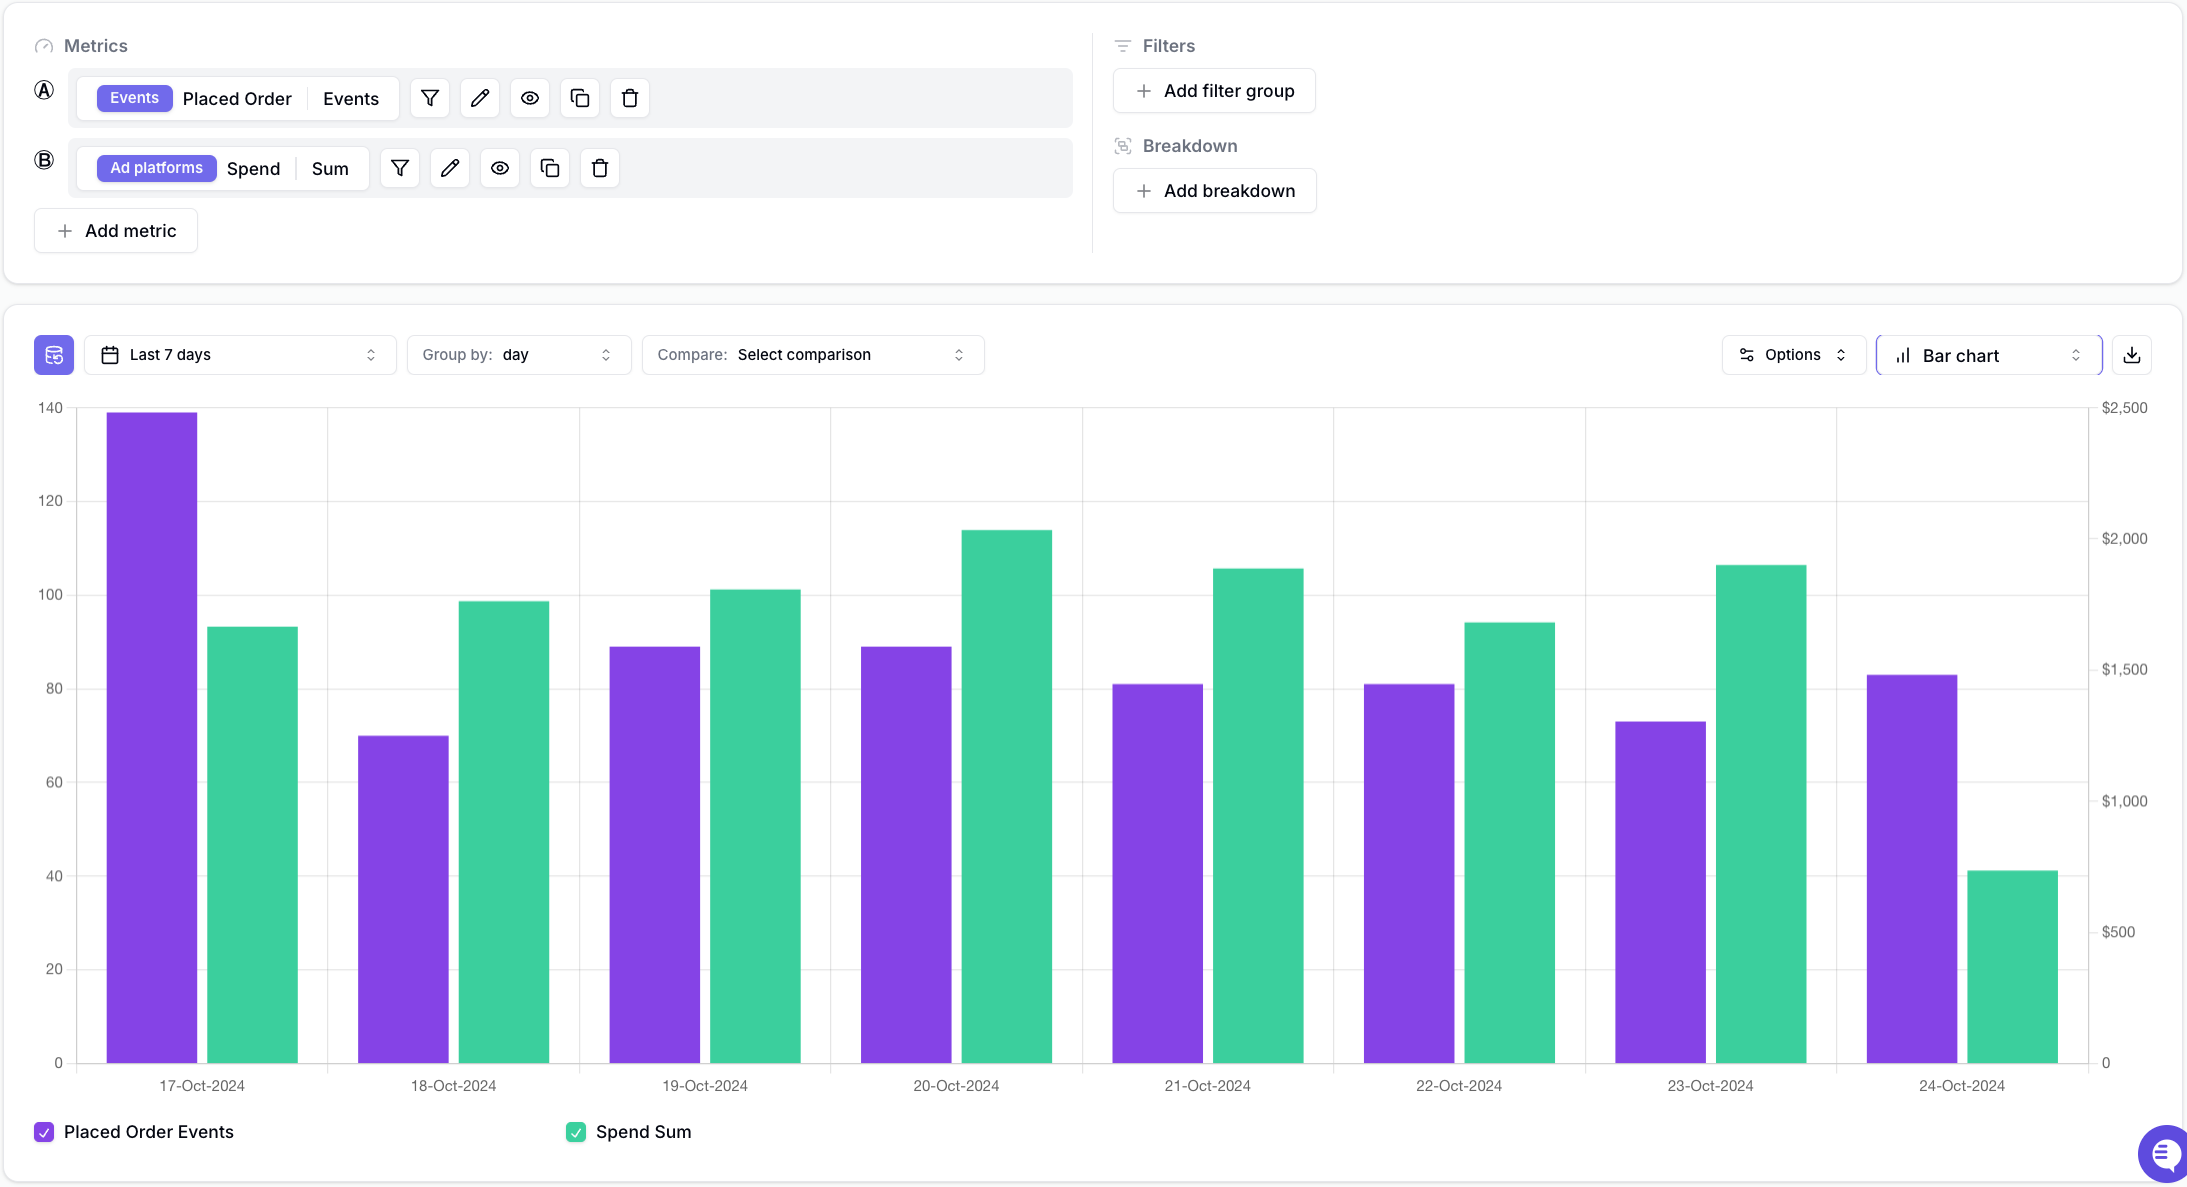
#### Bar Chart

<Frame>
  <img src="https://mintcdn.com/converge/ecGnucKsPgTlQzkL/images/insights-dashboards/visualization-example-bar-chart.png?fit=max&auto=format&n=ecGnucKsPgTlQzkL&q=85&s=e7c4a4adf8accf73973f617dd2cc5ce1" alt="three-metrics" width="2187" height="1187" data-path="images/insights-dashboards/visualization-example-bar-chart.png" />
</Frame>

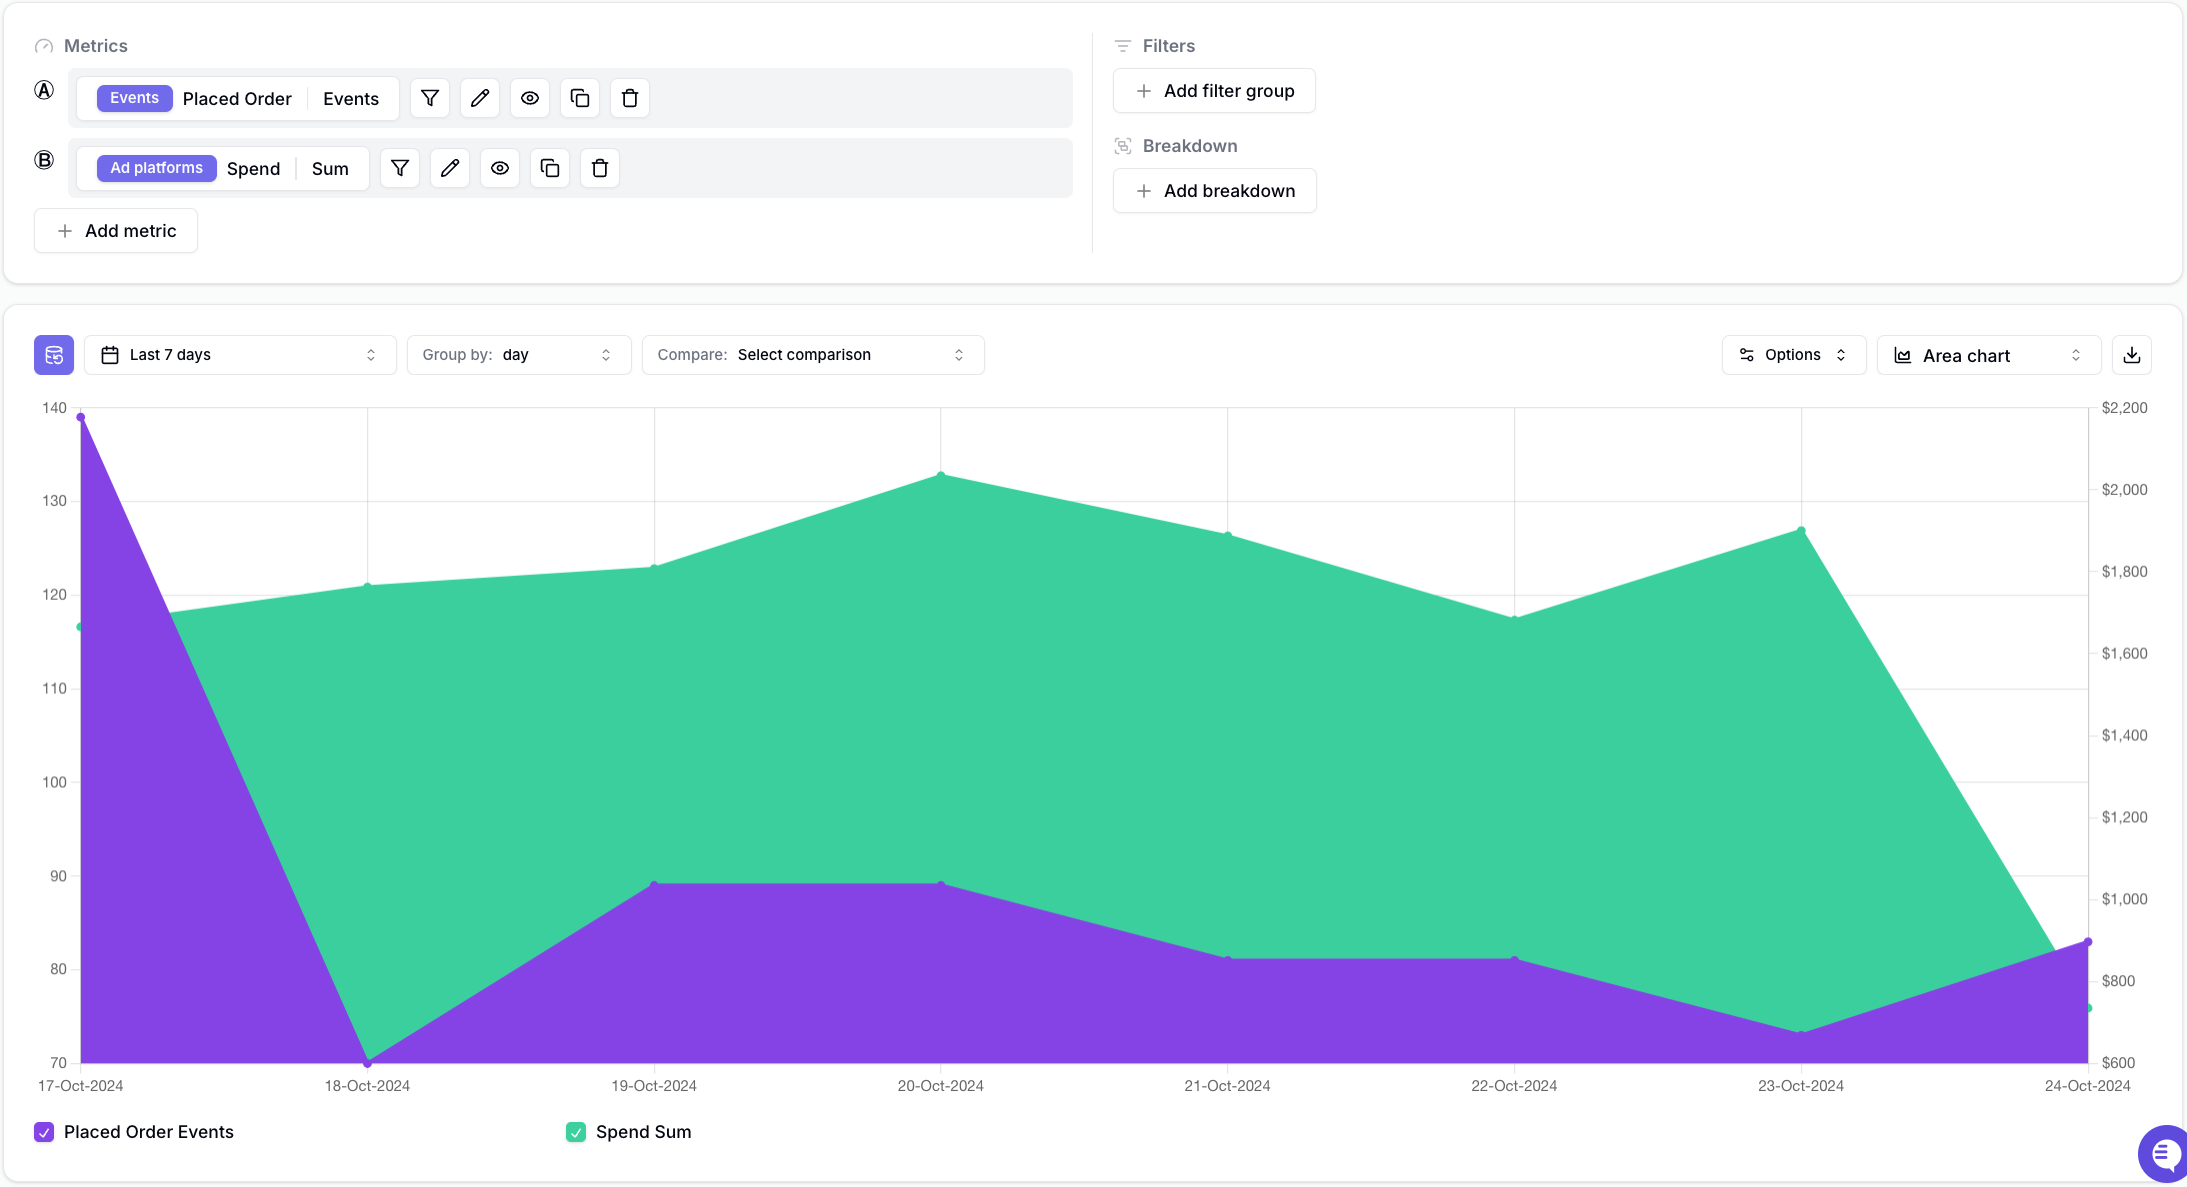
#### Area Chart

<Frame>
  <img src="https://mintcdn.com/converge/ecGnucKsPgTlQzkL/images/insights-dashboards/visualization-example-area-chart.png?fit=max&auto=format&n=ecGnucKsPgTlQzkL&q=85&s=ff460f0f7b89268508cf3168f960c961" alt="three-metrics" width="2187" height="1187" data-path="images/insights-dashboards/visualization-example-area-chart.png" />
</Frame>

### Totals visualization types

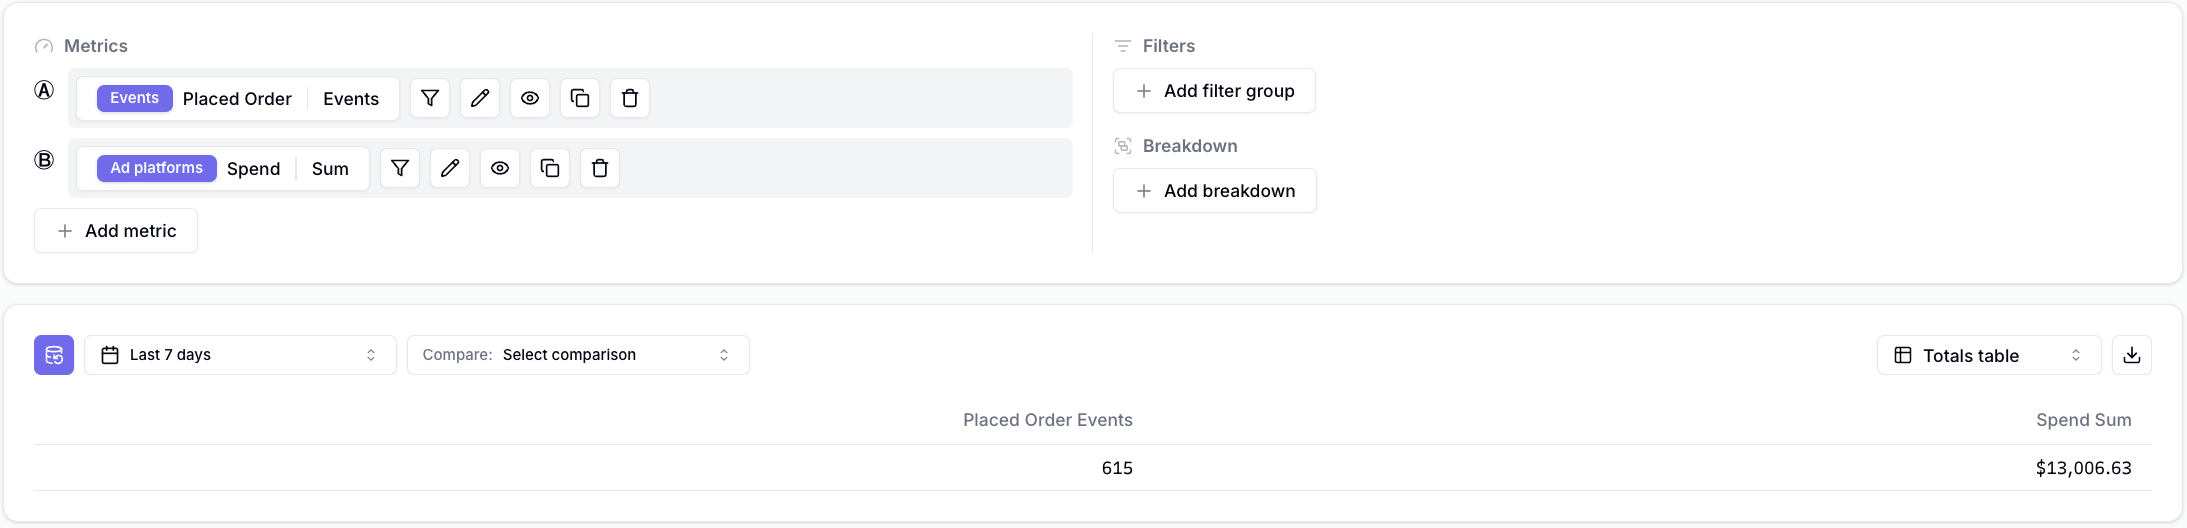
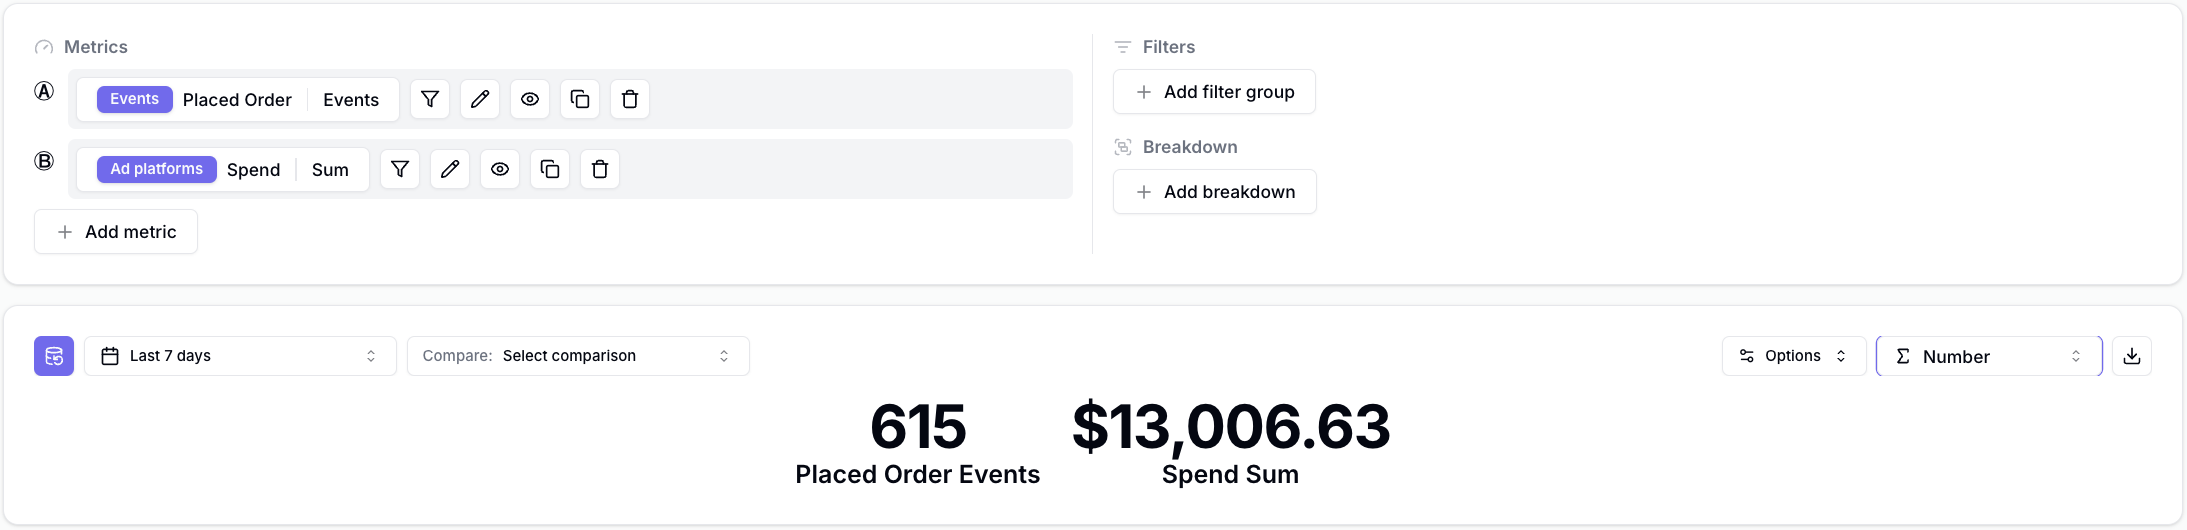
Totals visualization types show you the total value of metrics over a specific period.

#### Totals Number Chart
<Frame>
  <img src="https://mintcdn.com/converge/ecGnucKsPgTlQzkL/images/insights-dashboards/visualization-example-totals-number-chart.png?fit=max&auto=format&n=ecGnucKsPgTlQzkL&q=85&s=4836f1ead52ea88bf4cfda36479bc8ec" alt="three-metrics" width="2187" height="530" data-path="images/insights-dashboards/visualization-example-totals-number-chart.png" />
</Frame>

#### Totals Table

<Frame>
  <img src="https://mintcdn.com/converge/ecGnucKsPgTlQzkL/images/insights-dashboards/visualization-example-totals-table.png?fit=max&auto=format&n=ecGnucKsPgTlQzkL&q=85&s=8b2f760462bcd5edcc116d3c8e226d16" alt="three-metrics" width="2187" height="528" data-path="images/insights-dashboards/visualization-example-totals-table.png" />
</Frame>

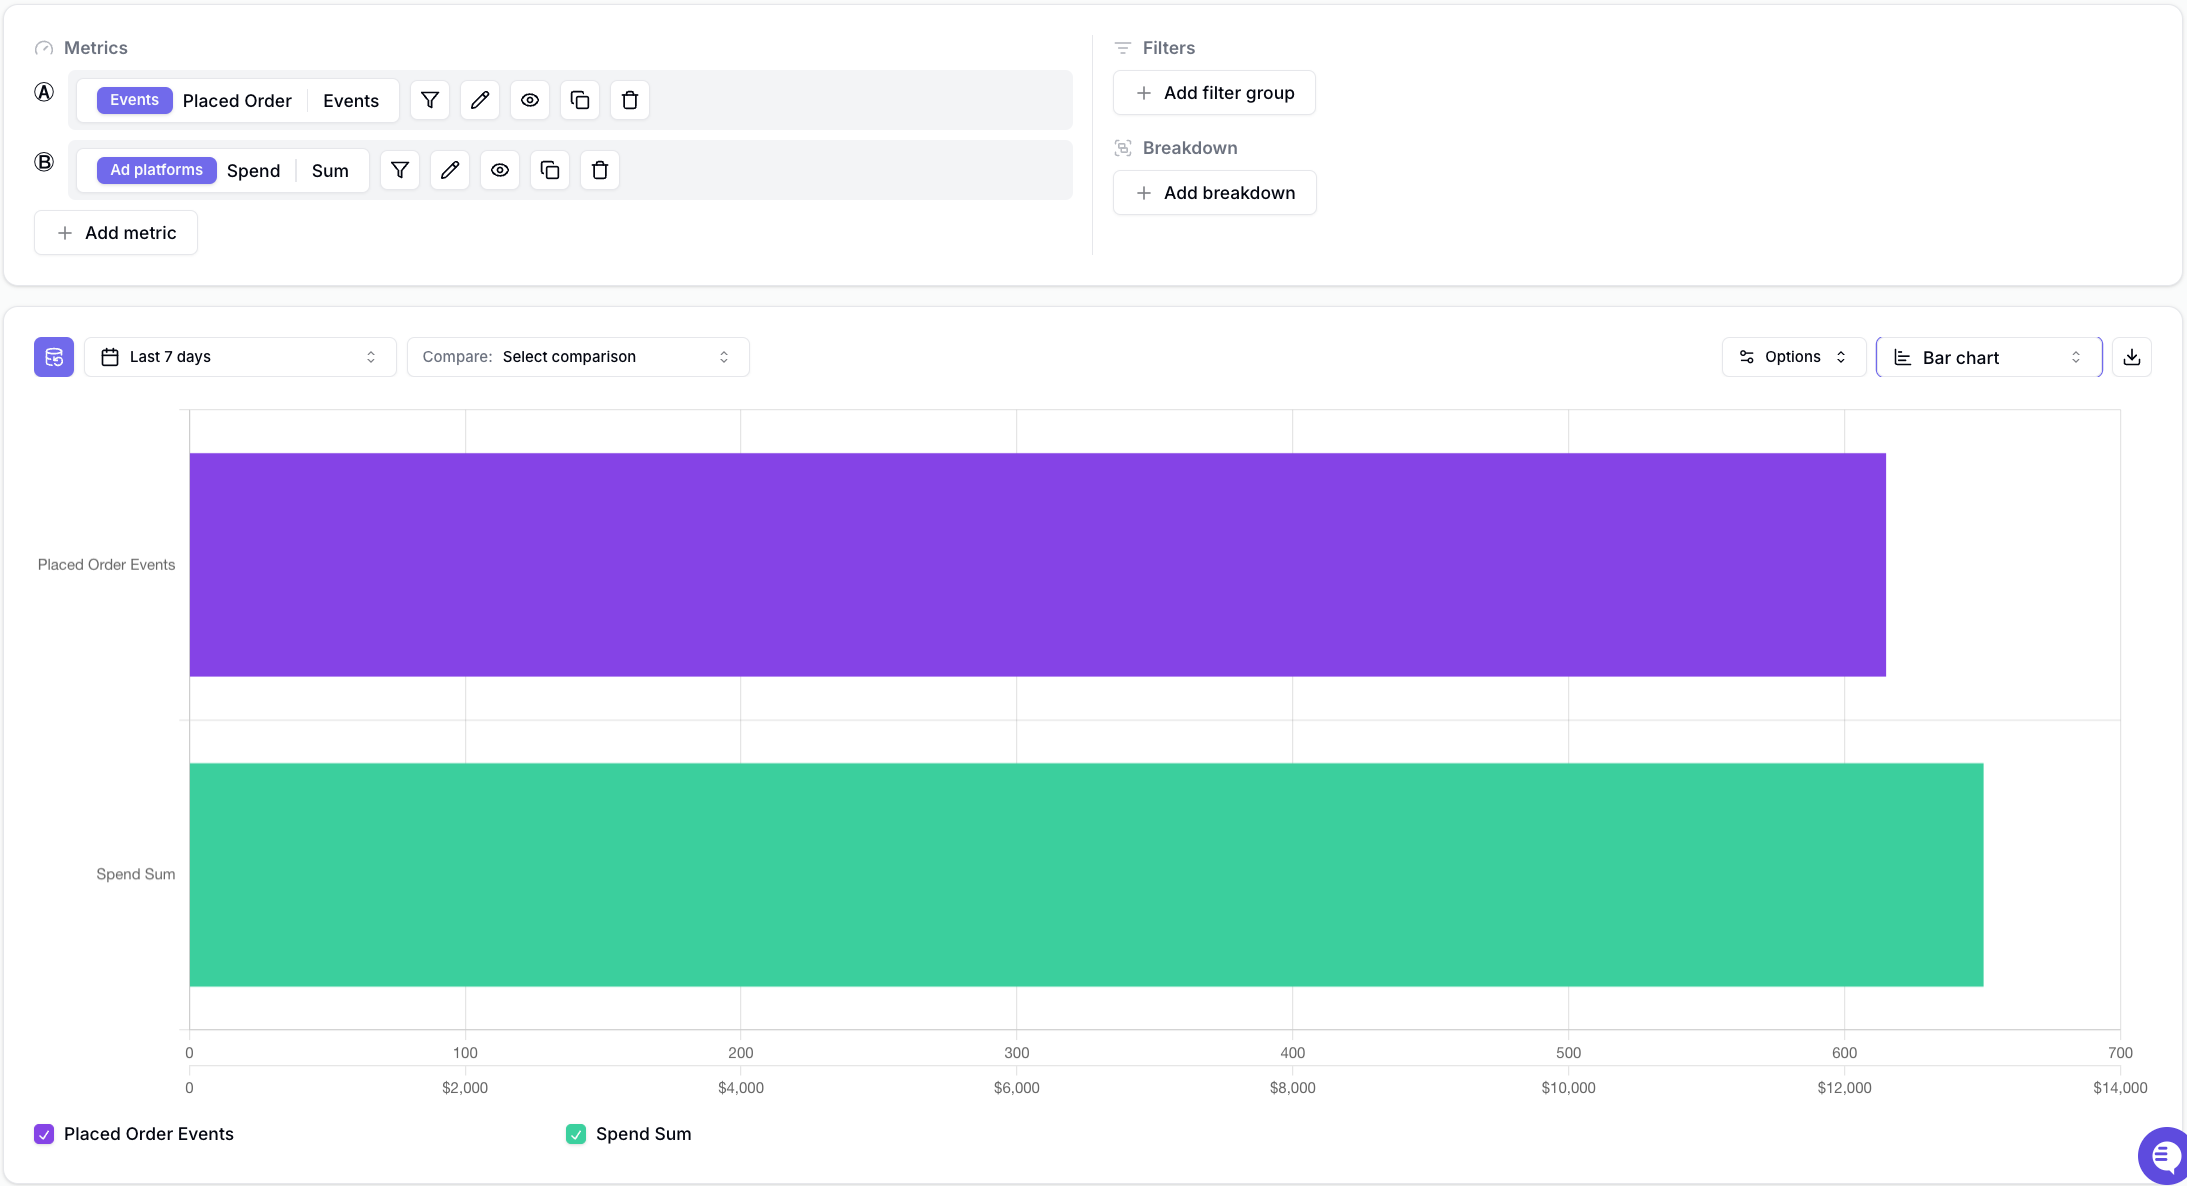
#### Totals Bar Chart

<Frame>
  <img src="https://mintcdn.com/converge/ecGnucKsPgTlQzkL/images/insights-dashboards/visualization-example-totals-bar-chart.png?fit=max&auto=format&n=ecGnucKsPgTlQzkL&q=85&s=5839c4cac0321bd0d973e441b26f4669" alt="three-metrics" width="2187" height="1186" data-path="images/insights-dashboards/visualization-example-totals-bar-chart.png" />
</Frame>

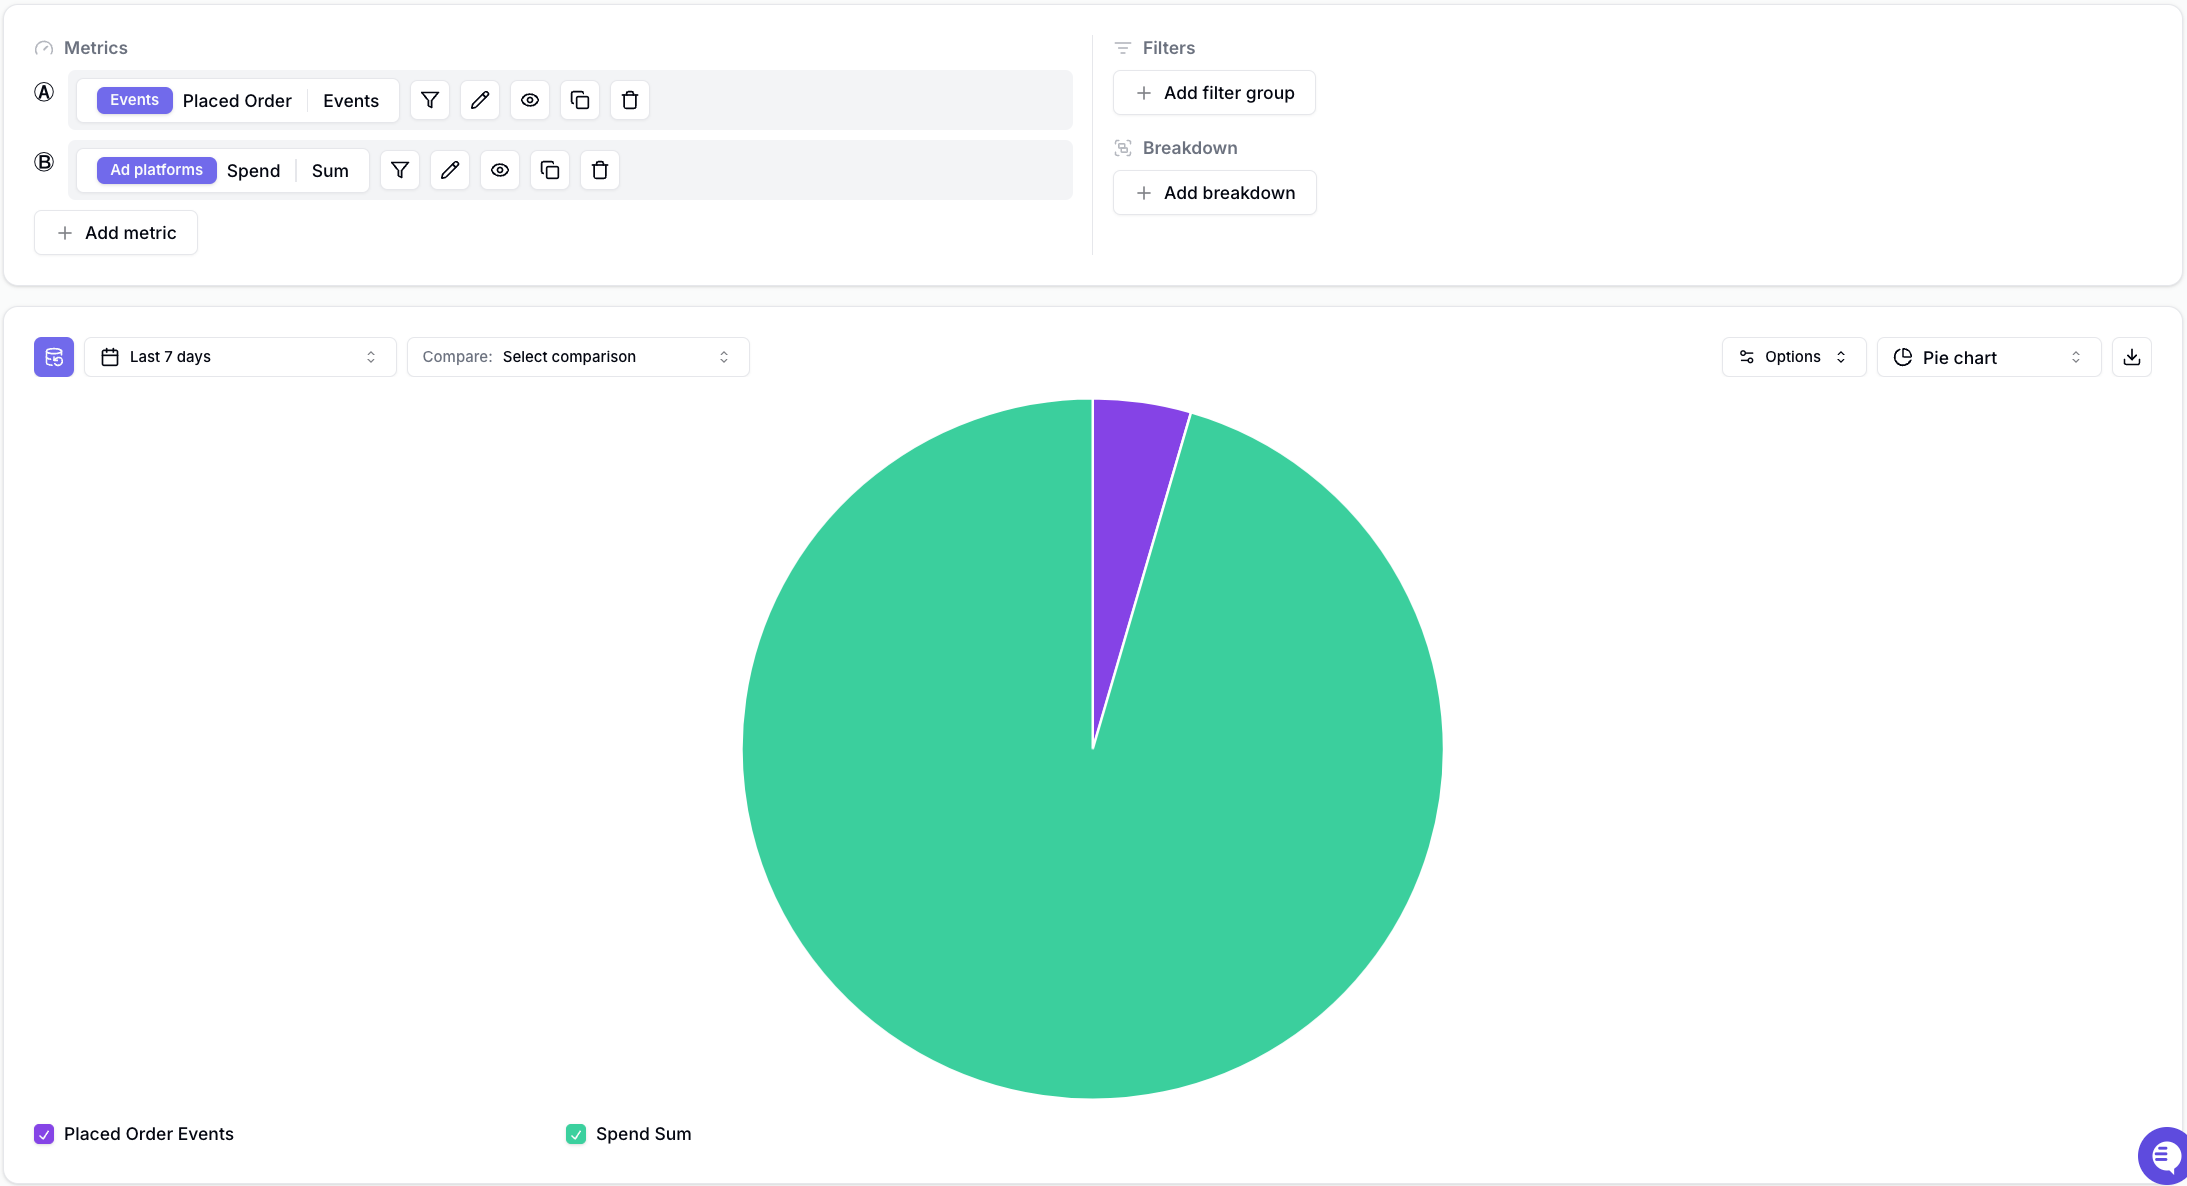
#### Totals Pie Chart

<Frame>
  <img src="https://mintcdn.com/converge/ecGnucKsPgTlQzkL/images/insights-dashboards/visualization-example-totals-pie-chart.png?fit=max&auto=format&n=ecGnucKsPgTlQzkL&q=85&s=5d8a597b06e961b453469fa78071af60" alt="three-metrics" width="2187" height="1186" data-path="images/insights-dashboards/visualization-example-totals-pie-chart.png" />
</Frame>

## Visualization Options

### Show values

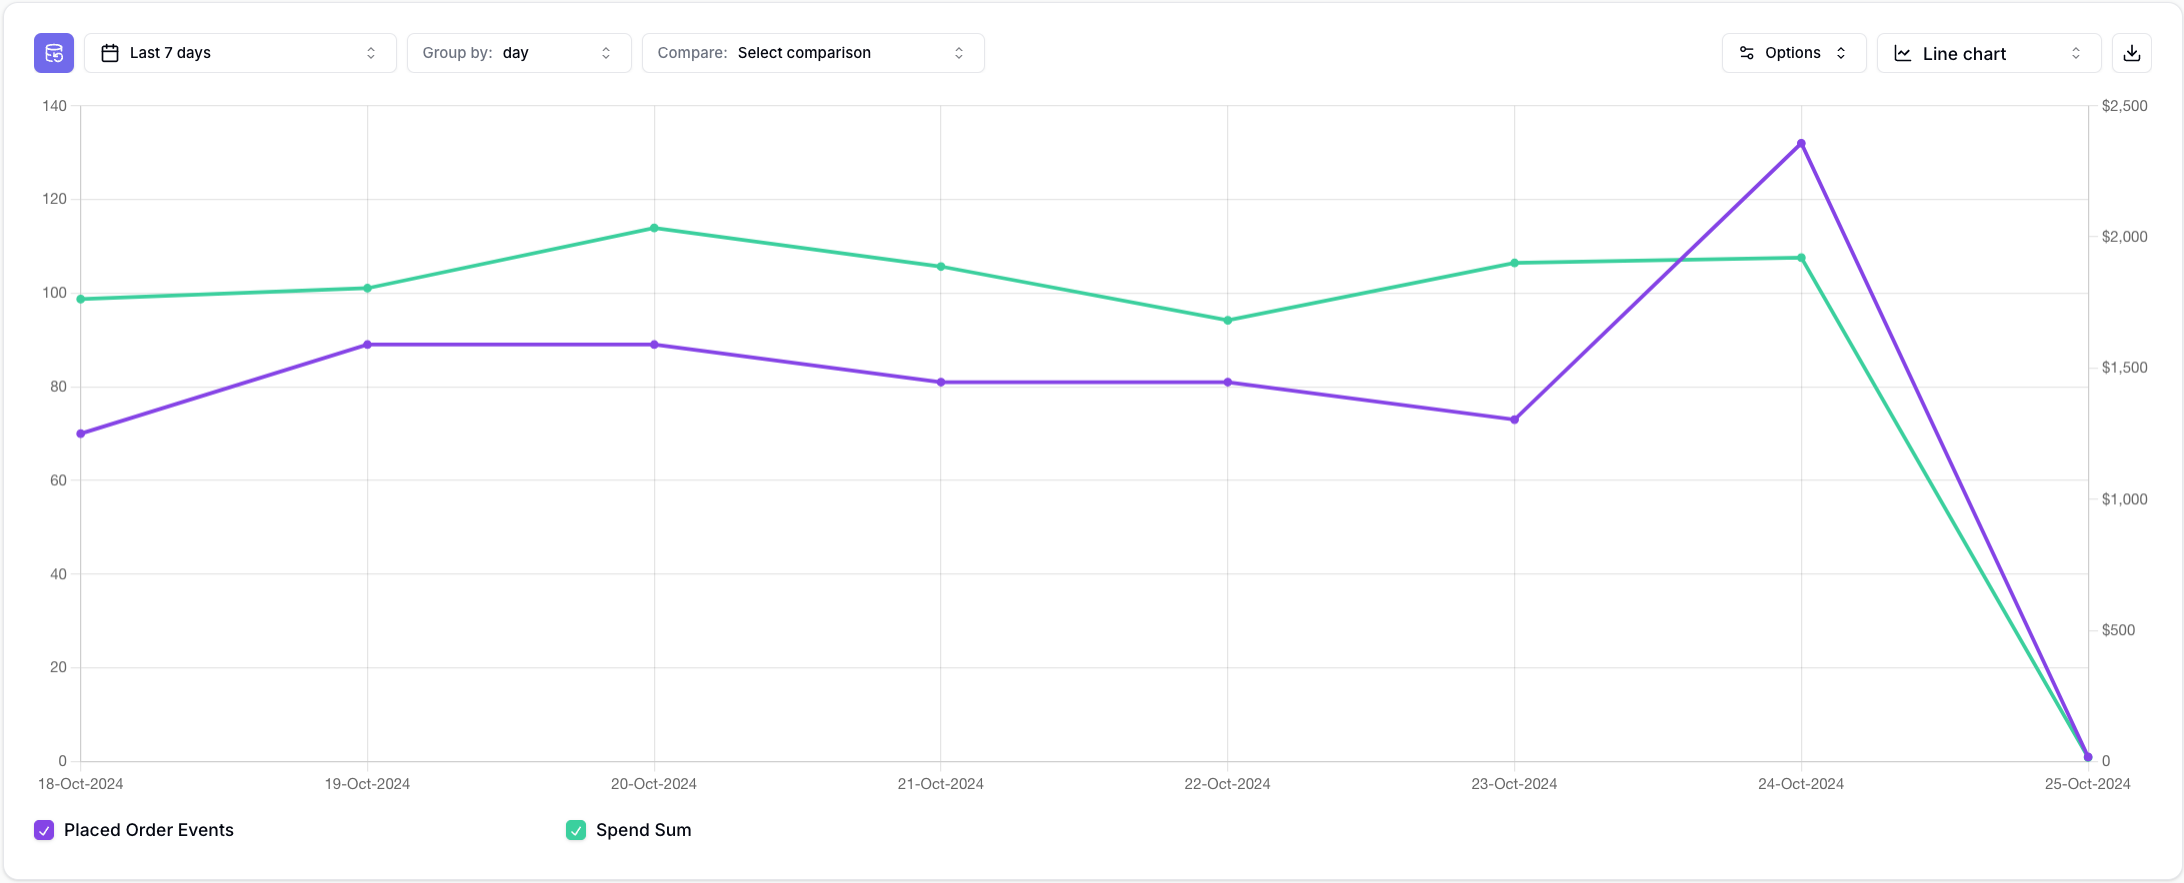
The **Show values** visualization option allows you to add labels to each line-chart data point.
As an example, observe the following insight without any labels.
<Frame>
  <img src="https://mintcdn.com/converge/ecGnucKsPgTlQzkL/images/insights-dashboards/visualization-option-no-labels-example.png?fit=max&auto=format&n=ecGnucKsPgTlQzkL&q=85&s=bfe0b4a0a5229335c856cbd03a3737d1" alt="no labels example" width="2184" height="883" data-path="images/insights-dashboards/visualization-option-no-labels-example.png" />
</Frame>

With labels, this becomes:

<Frame>
  <img src="https://mintcdn.com/converge/ecGnucKsPgTlQzkL/images/insights-dashboards/visualization-option-labels-example.png?fit=max&auto=format&n=ecGnucKsPgTlQzkL&q=85&s=57ed8961ffe0b53345302042742d4545" alt="no labels example" width="2184" height="883" data-path="images/insights-dashboards/visualization-option-labels-example.png" />
</Frame>

To configure **Show values**:

1. Click on <IconText text="Options" name="sliders-simple" /> in the top right corner of your insight.
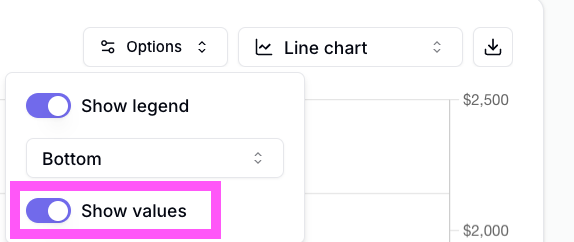
2. Tick on **Show values**
   <Frame>
     <img src="https://mintcdn.com/converge/ecGnucKsPgTlQzkL/images/insights-dashboards/visualization-option-labels-instruction.png?fit=max&auto=format&n=ecGnucKsPgTlQzkL&q=85&s=3d9b871d720cd8c3743caed169422d8a" alt="labels instruction" width="574" height="242" data-path="images/insights-dashboards/visualization-option-labels-instruction.png" />
   </Frame>
3. Done.

### Legend

You can choose to optionally **Hide** the legend or move it to the Top, Bottom, Left, or Right of the insight.

To configure:

1. Click on <IconText text="Options" name="sliders-simple" /> in the top right corner of your insight.
2. Choose whether you want to show the legend and where.
3. Done.