

Routines
Schedule an AI agent powered by the Converge MCP to post analytics straight to Slack or email. Daily revenue snapshots, weekly conversion deep-dives, anything you’d otherwise pull by hand.Each routine runs a prompt on a recurring basis and delivers the result to your channel or inbox, using live data from your workspace every time.Learn more or set one upConverge MCP
Ask your AI assistant questions about your marketing data. No dashboards, no exports, just plain language.The Converge MCP server connects to Claude, ChatGPT, or any MCP-compatible client and gives it read access to your analytics data. Compare campaigns, break down ROAS by ad, or check channel performance without leaving the chat.Set it up in under a minute: point your AI assistant tohttps://app.runconverge.com/api/mcp, sign in with Google, and start asking.Learn more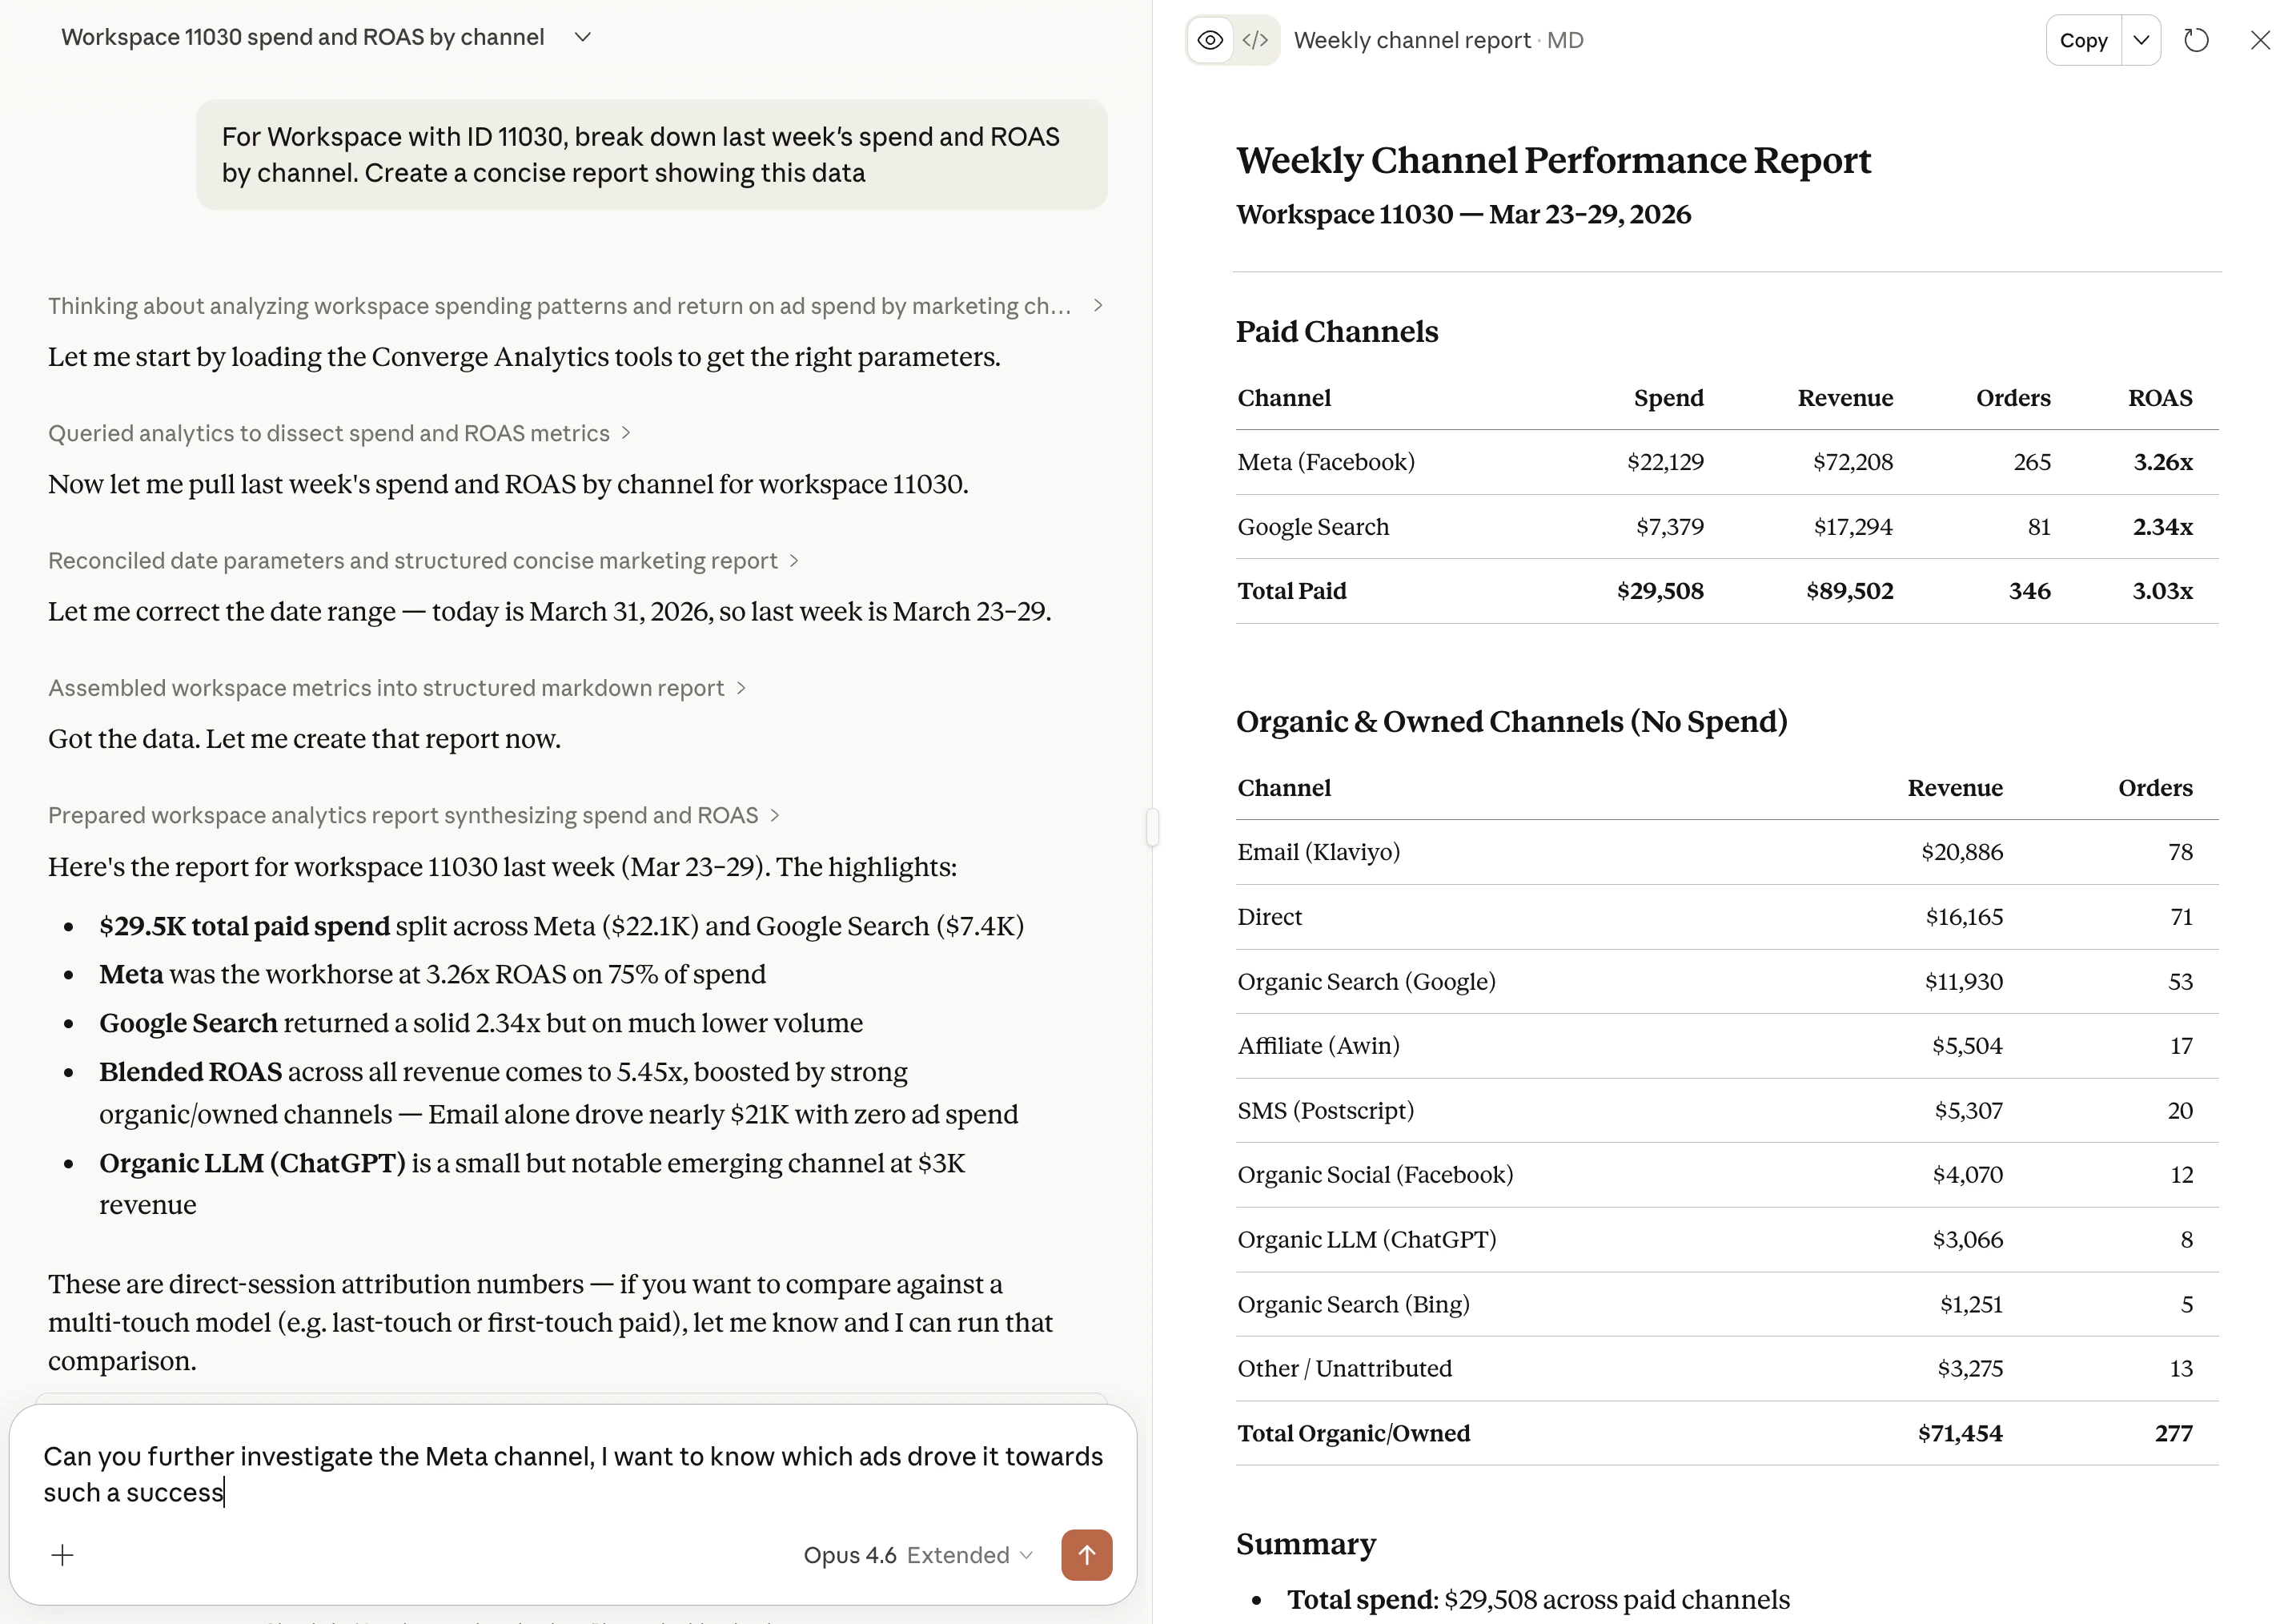
Product analytics
See which products are bringing in the most revenue and which channels are generating their sales in the new Product report.Find it hereViews in Overview
You can now create Views in the Overview report to save customized versions of the report.Use it to view results per country or focus on specific metrics.New Landing pages report
The Landing pages report received an upgrade.Use it to see how your landing pages are performing.Ad filters
Filter the Attribution report by ad status, ad creation date, or ad landing page.Use it to narrow down the ads that need your attention.Ad details
View your Meta ads details directly in Converge.No more switching between Meta and Converge to add context to the results you’re seeing.Store Dimensions
Model your real business structure in Converge with custom dimensions like brand, region, or channel.Then report marketing performance across them to clearly see how Brand 1 actually performs vs Brand 2.Learn moreCharting in the attribution table
Turn any set of attribution table rows and metrics into a trend chart. See at a glance whether a “losing” ad is just having a bad day - or actually fatiguing.Try it outPacing Product
Analyze your acquisition metrics and spend pacing over time to spot trends and outliers in the new Pacing tab.Learn more or Try it outNew visitor metrics
Analyze whether your ads are bringing in new or recurring visitors with our new visitor metrics. New visitor metrics are available in the Overview, Attribution-table and in InsightsGoogle Sheets Import
Import and report on all of your out-of-platform spend such as influencers, newsletters, podcasts, etc. using our new Google Sheets integration.Learn moreChannel Groups
Get a high-level overview of how the different types of channels are performing with Channel Groups in the Attribution report.Learn moreKlaviyo marketing source
You can now connect Klaviyo directly to Converge. Import metrics such as emails sent, opened, clicked, and converted to enrich your email performance reporting.Learn more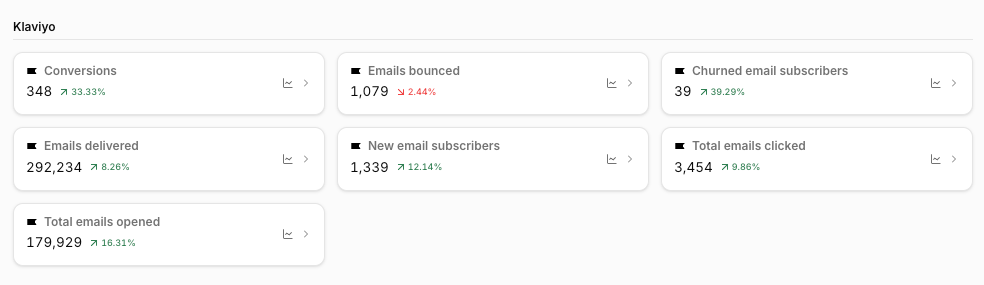
Add views in the Attribution
You can now save your Attribution reports as Views, giving you instant access to your most customized reporting setups.Learn moreShare Dashboards & Insights
Now you can generate a public link to a Dashboard or Insight and share it directly with agencies, partners, or teams.Learn morePixel Monitor
Pixel Monitors allow you to automatically check your tracking pixel across all your sites and alert you if it’s removed in an update.Learn moreTracking Parameter Check
Check if all your Converge tracking parameters have been set up correctly.Optimizing your tracking parameters will enhance your reports in Converge.Data Warehouse Sync
Syncing the Attribution report to your data warehouse is now in beta.Export all your results, with all attribution models, to Google BigQuery to use in your favorite BI tool.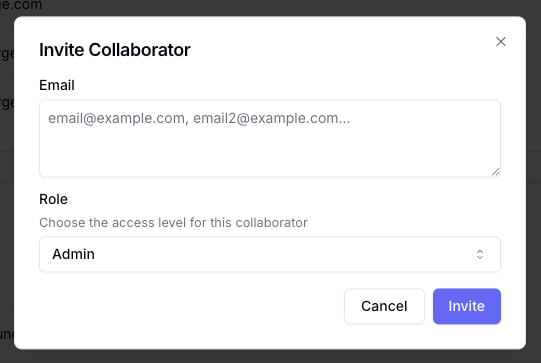
Server-Side Only event mapping
Only forward your events server-side, with the Server-Side Only event mapping for the Facebook and TikTok destinations.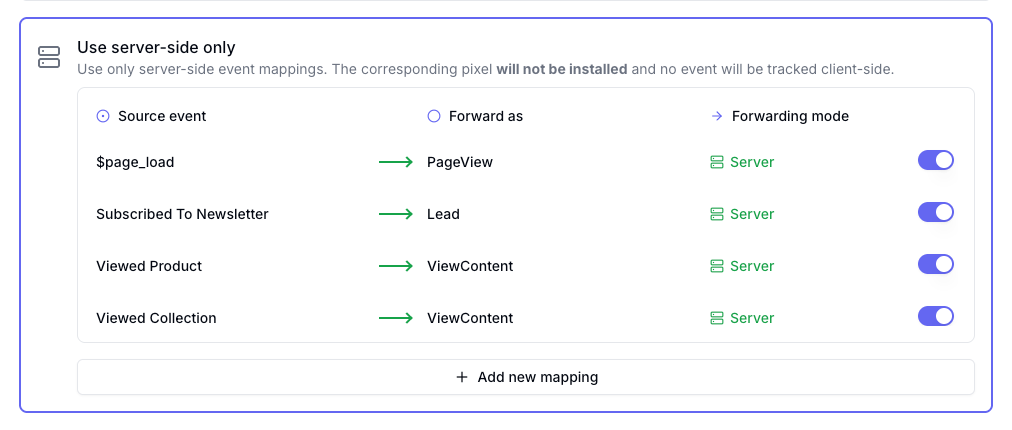
Client-side filters available in Destination
You can now add filters for your client-side events to every Destination.Session-based metrics added to reports
You can now add the following session-based metrics to your reports:- Bounce rate: Percentage of sessions that resulted in a bounce.
- Session duration: Average session duration.
- Revenue per session: Average revenue generated per session.
User access control
Control what your users can access in your workspace by giving them any of the following roles:- Admin: Full access to all features and settings.
- Editor: Access to all features and settings, except removing members.
- Analyst: Can only create insights and dashboards.
- Viewer: Read-only to features and settings without the ability to make changes.
Custom event mapping for Destinations
Take control of your destination mappings with Custom Mappings.- Use the Default mapping from Converge.
- Use a Custom mapping to add, edit, or remove mappings.
- Select a forwarding mode (client and/or server) for each of your events.