Where to find the Overview Report
You can access the Overview Report by clicking onOverview
in the Analytics section.
Video Demo
Check the Metrics Dictionary to understand the precise definition of all of these metrics
Customizing the Overview
You can customize the overview by clicking onEdit overview
in the top right corner.
Add or remove metrics
Add or remove metrics
You can choose to hide an entire section (e.g. all Facebook Metrics) or specific metrics within a section.Hide an entire section
- Click on Edit overviewin the top right corner of the Overview dashboard
- Click on the -icon next to the category you want to hide so it appears in a disabled state.
- Click Save.
- Click on Edit overviewin the top right corner of the Overview dashboard
- Click on the -icon next to the category to which you want to remove or add a card.
- In the list of metrics of the section, click on the -icon next to the metric you want to hide so it appears in a disabled state.
- Click Save.
Change the order of the metrics
Change the order of the metrics
You can change the order of an entire section (e.g., all Facebook Metrics) or specific metrics within a section.Re-order an entire section
- Click on Edit overviewin the top right corner of the Overview dashboard
- Drag and re-order the section by grabbing onto the -icon and moving it above or under other sections.
- Click Save.
- Click on Edit overviewin the top right corner of the Overview dashboard
- Click on the -icon next to the category in which you want to reorganize cards.
- Drag and re-order the metric by grabbing onto the -icon and moving it above or under other sections.
- Click Save.
Overview Report on Mobile
Converge doesn’t have a mobile app, but you can add the Overview Report to your home screen to check your main acquisition KPIs on the go.Add to Home Screen on iOS
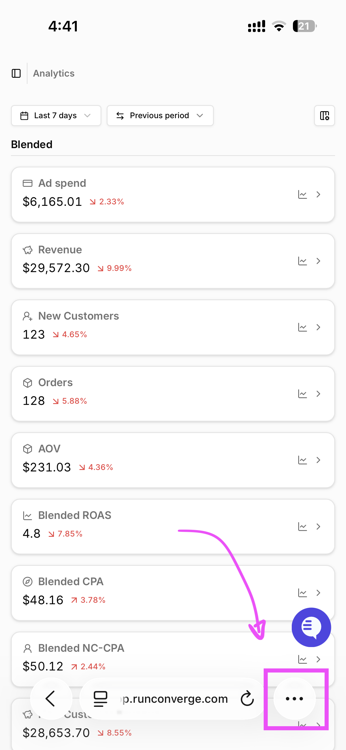
- Navigate to app.runconverge.com in Safari
-
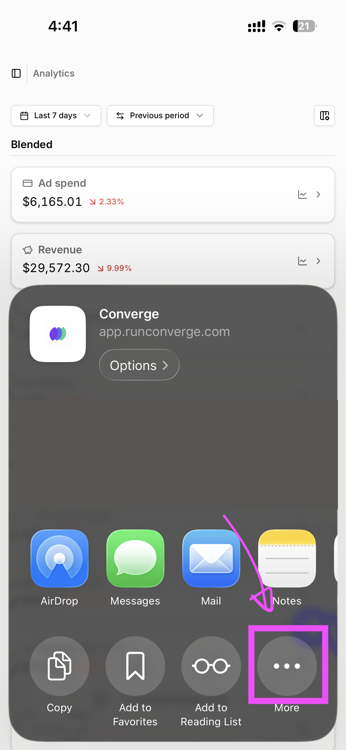
Tap the Share button at the bottom of the screen
-
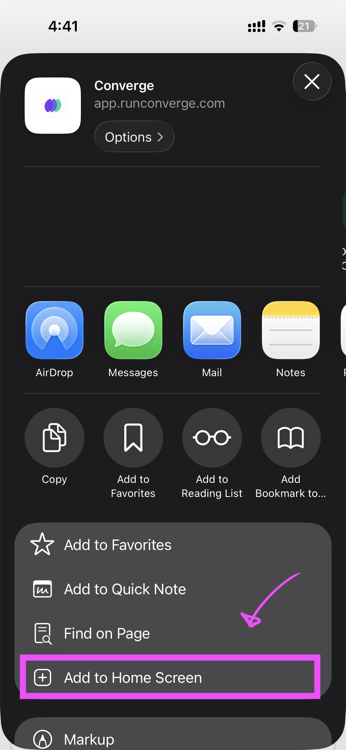
Scroll down and tap Add to Home Screen
-
Tap Add in the top right corner
-
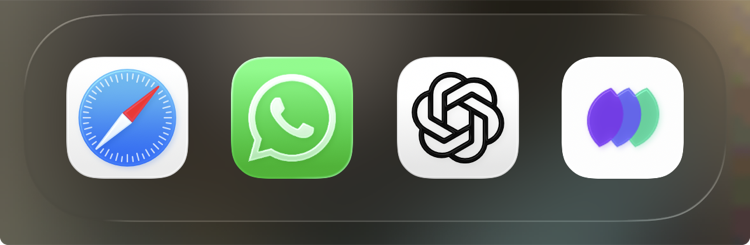
The Converge icon will now appear on your home screen.
Add to Home Screen on Android
- Navigate to app.runconverge.com in Chrome
- Tap the three-dot menu in the top right corner
- Tap Add to Home screen
- Enter a name (or keep the default) and tap Add
- Tap Add again in the confirmation dialog
- The Converge icon will now appear on your home screen
FAQ
Why are my Shopify Sales and Converge Revenues misaligned?
Why are my Shopify Sales and Converge Revenues misaligned?
The Converge Revenues card and the Shopify Sales card show slightly different metrics.Specifically, Converge includes gift card revenue in your total revenue number, and it doesn’t subtract refunds.
Shopify, however, shows a sales number with refunds already subtracted and without gift card revenue.In short:
- Shopify Sales =
Gross Revenue-Refunds-Gift card revenue - Converge Revenue =
Gross Revenue