Where to find the Attribution Report
You can access the Attribution report by clicking onAttribution
in the Analytics section of the main navigation. Or by navigating directly to the Attribution report.
Video Demo
Introduction to conversions and attribution
Converge allows you to see attributed conversions based on:- First-party Attribution: these are conversions attributed by Converge based on the attribution model you pick in Converge and your Converge tracking parameters. You can recognize them by this icon: .
- In-Platform Attribution: these are conversions attributed by the ad platforms themselves. You can recognize all in-platform data by this icon:
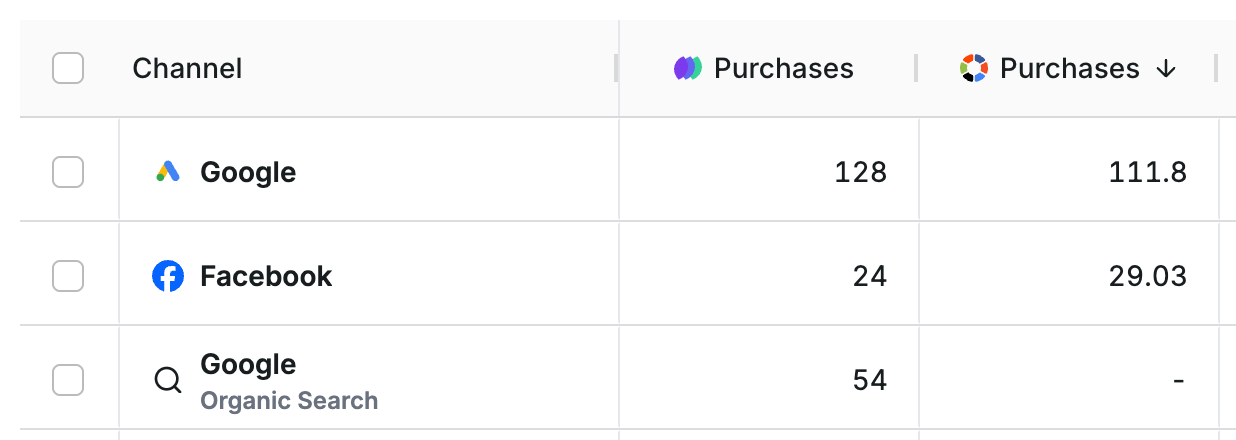
The screenshot above shows the purchase conversions based on First-party Attribution ( Purchases) and the In-Platform Attribution ( Purchases). There is no notion of in-platform attribution for channel sources that are not ad platforms. An Organic channel has no built-in attribution, but the Facebook Ads Manager does.
Why are my First-Party conversions and my In-Platform conversions different?
If you are using the Converge Destination product, then the same data is powering your first-party attribution and your in-platform attribution. However, the attributed conversions based on first-party attribution and in-platform attribution will likely not match as they’re based on different attribution models. If you want to learn how to interpret these numbers and why they are different, then you should read our guide on understanding attribution.Changing the attribution model of your first-party conversions
Changing the attribution model will only change the attribution model of first-party metrics. The In-Platform conversions and metrics are determined by the attribution model of the ad platform itself.
See Attribution Models for a detailed description of all our attribution models.
Attribution Chart
The Attribution Chart provides a visual time-series view of your attribution data, helping you understand how conversions and other metrics evolve over time. To include time context in your attribution analysis, you can enable the Show chart toggle in the top right corner of the module.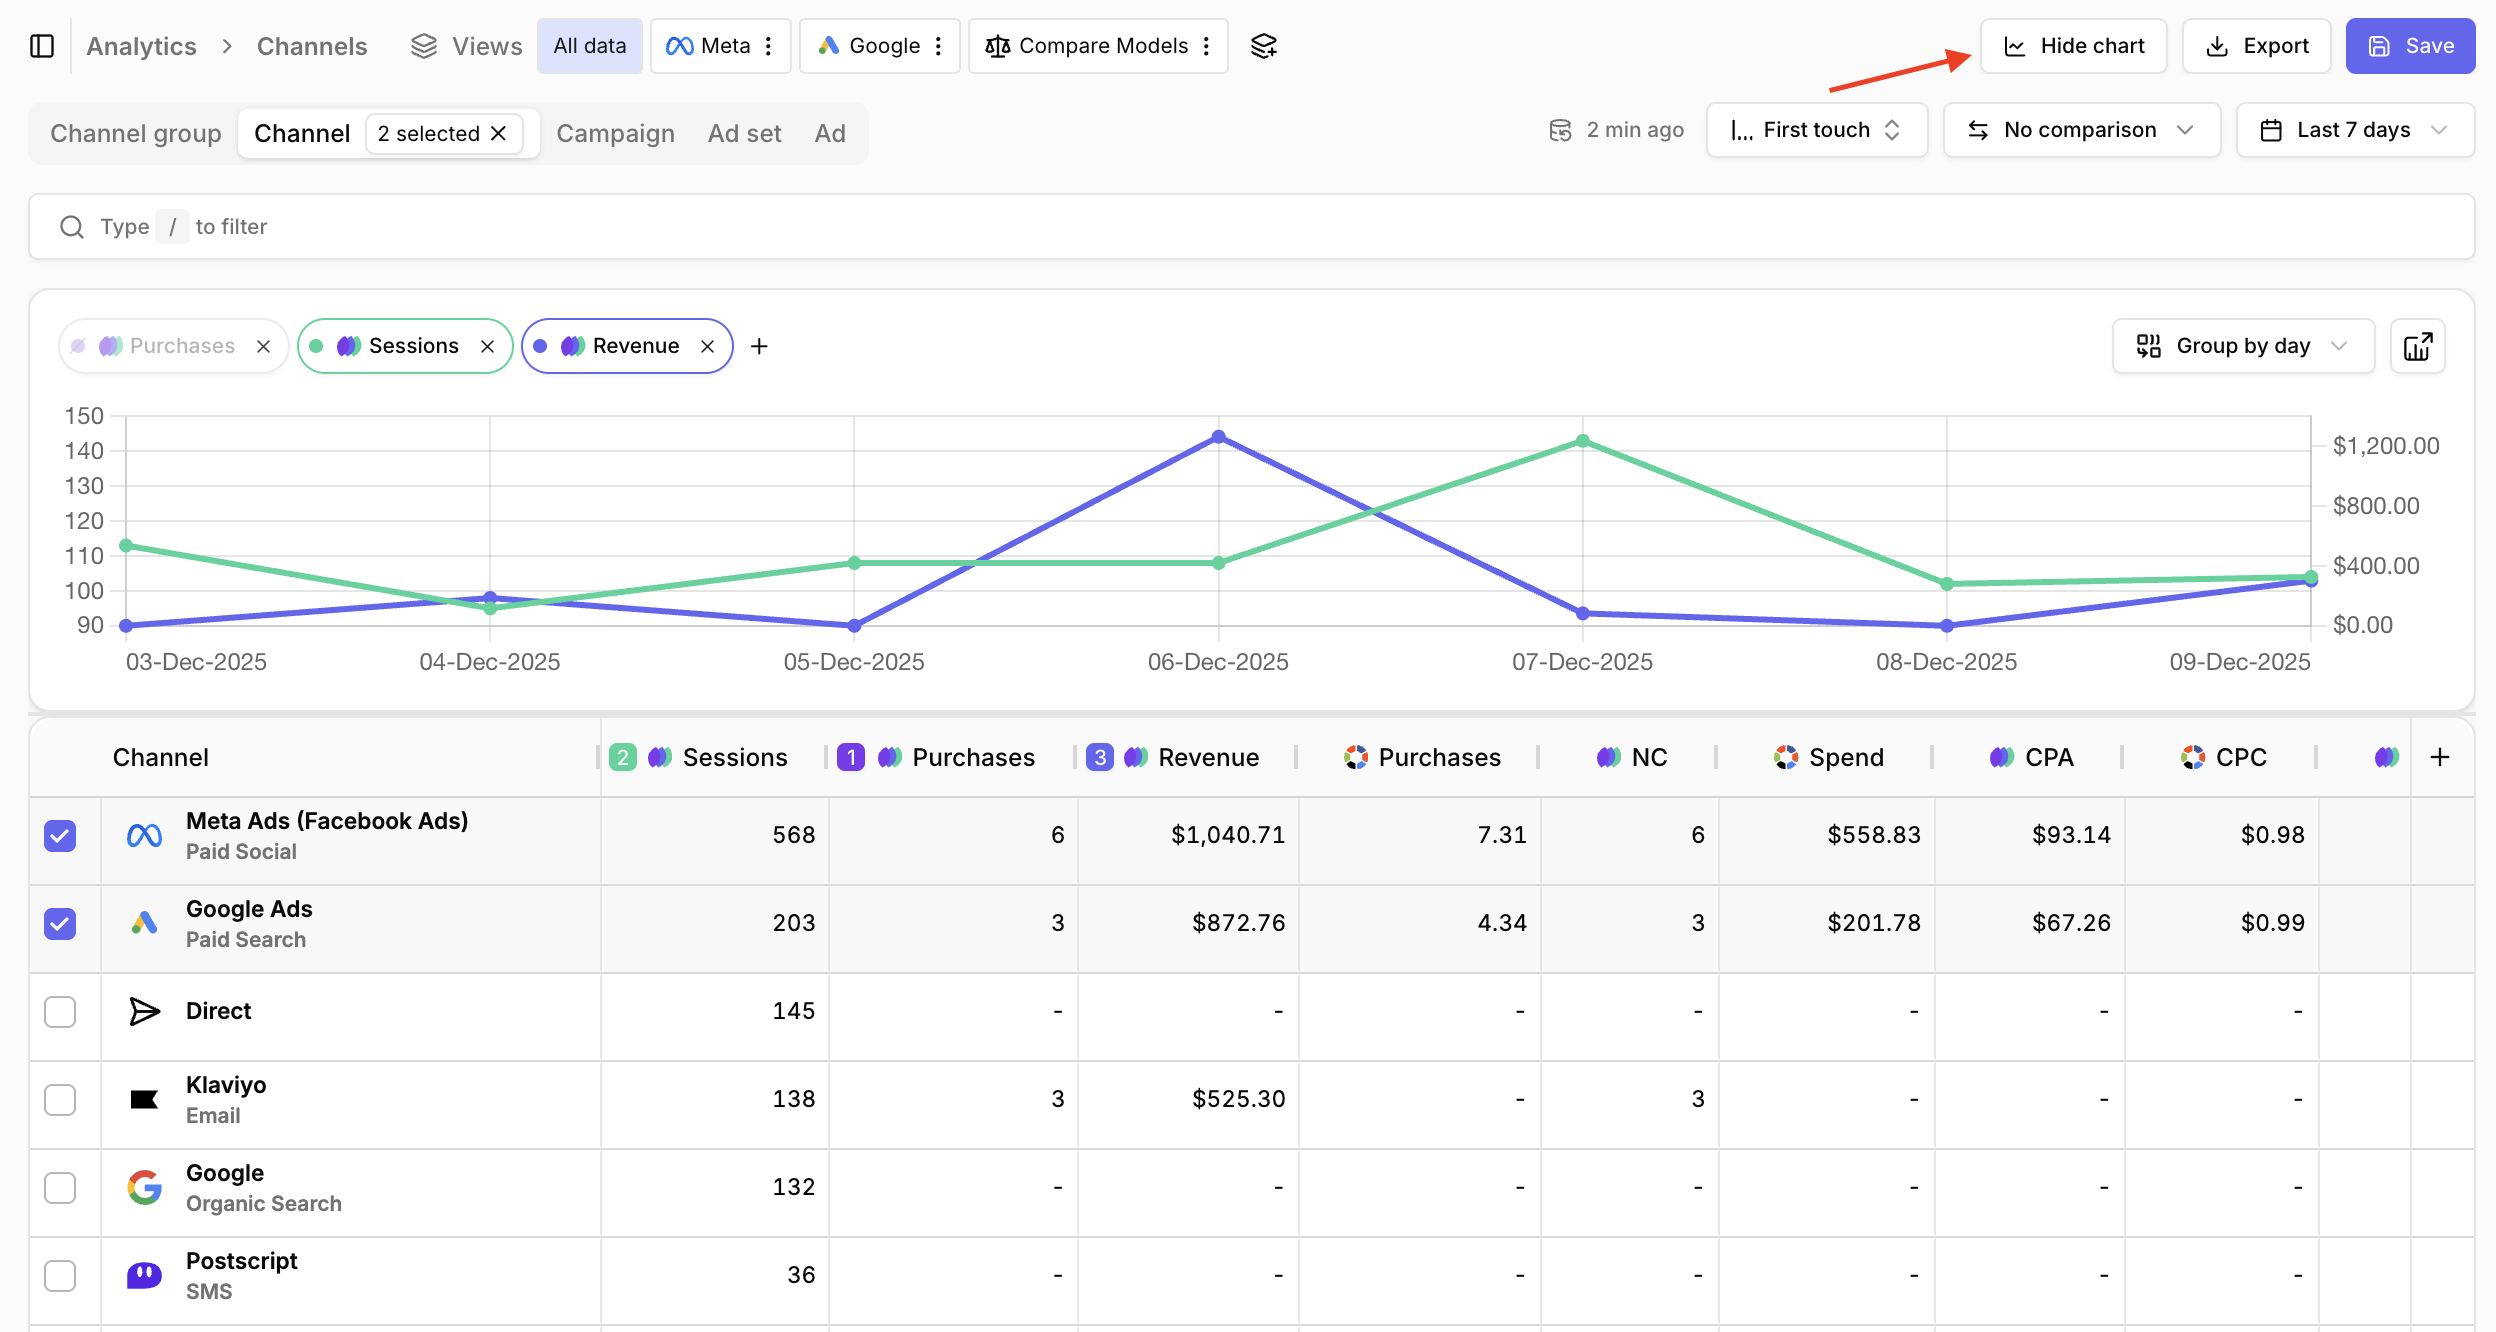
Managing Chart Metrics
You can add or remove metrics from the chart in two ways:- In the chart itself: Click the button in the chart header to add metrics from the available list. To remove a metric, click the icon on the metric toggle button. You can also toggle metric visibility on/off by clicking the metric toggle buttons directly.
- Through the table headers: Each metric column header includes a checkbox that allows you to add or remove that metric from the chart. Checkboxes are only visible when the chart is enabled. For metrics not yet in the chart, the checkbox appears when you hover over the column header.
The chart will only display metrics that are present in your table.
If you want to visualize a metric in the chart, make sure it’s added as a column in the table first.
Chart Data Selection
By default, when no rows are selected in the table, the chart displays all data that contributes to your current table view. Once you start selecting specific rows using the checkboxes in the table, the chart automatically updates to show only the data for your selected items.Advanced Customization
If you need more advanced chart customization options, such as different visualization types, additional filters, or the ability to save custom chart configurations, you can click the Open in Insights button in the top right corner of the chart header. This link will open the chart with its current settings in the Insights module. From there, you can further customize and save your chart separately.Customizing the table columns
You can customize the table by adding, moving, or removing columns.Add custom columns
Add custom columns
- Click on in the top right corner of the table.
- Search or select the metric you want to add.
- Select how you want to aggregate the metric. (optional)
- Click Save.
Check Metrics to see which metrics you can add.
Change the order of the columns
Change the order of the columns
- Drag and re-order the columns by grabbing onto the name of the column and moving it above or below other columns.
- Click Save.
Remove a column
Remove a column
- Hover over the column name and click the -icon next to the name.
- Click Remove.
- Click Save.