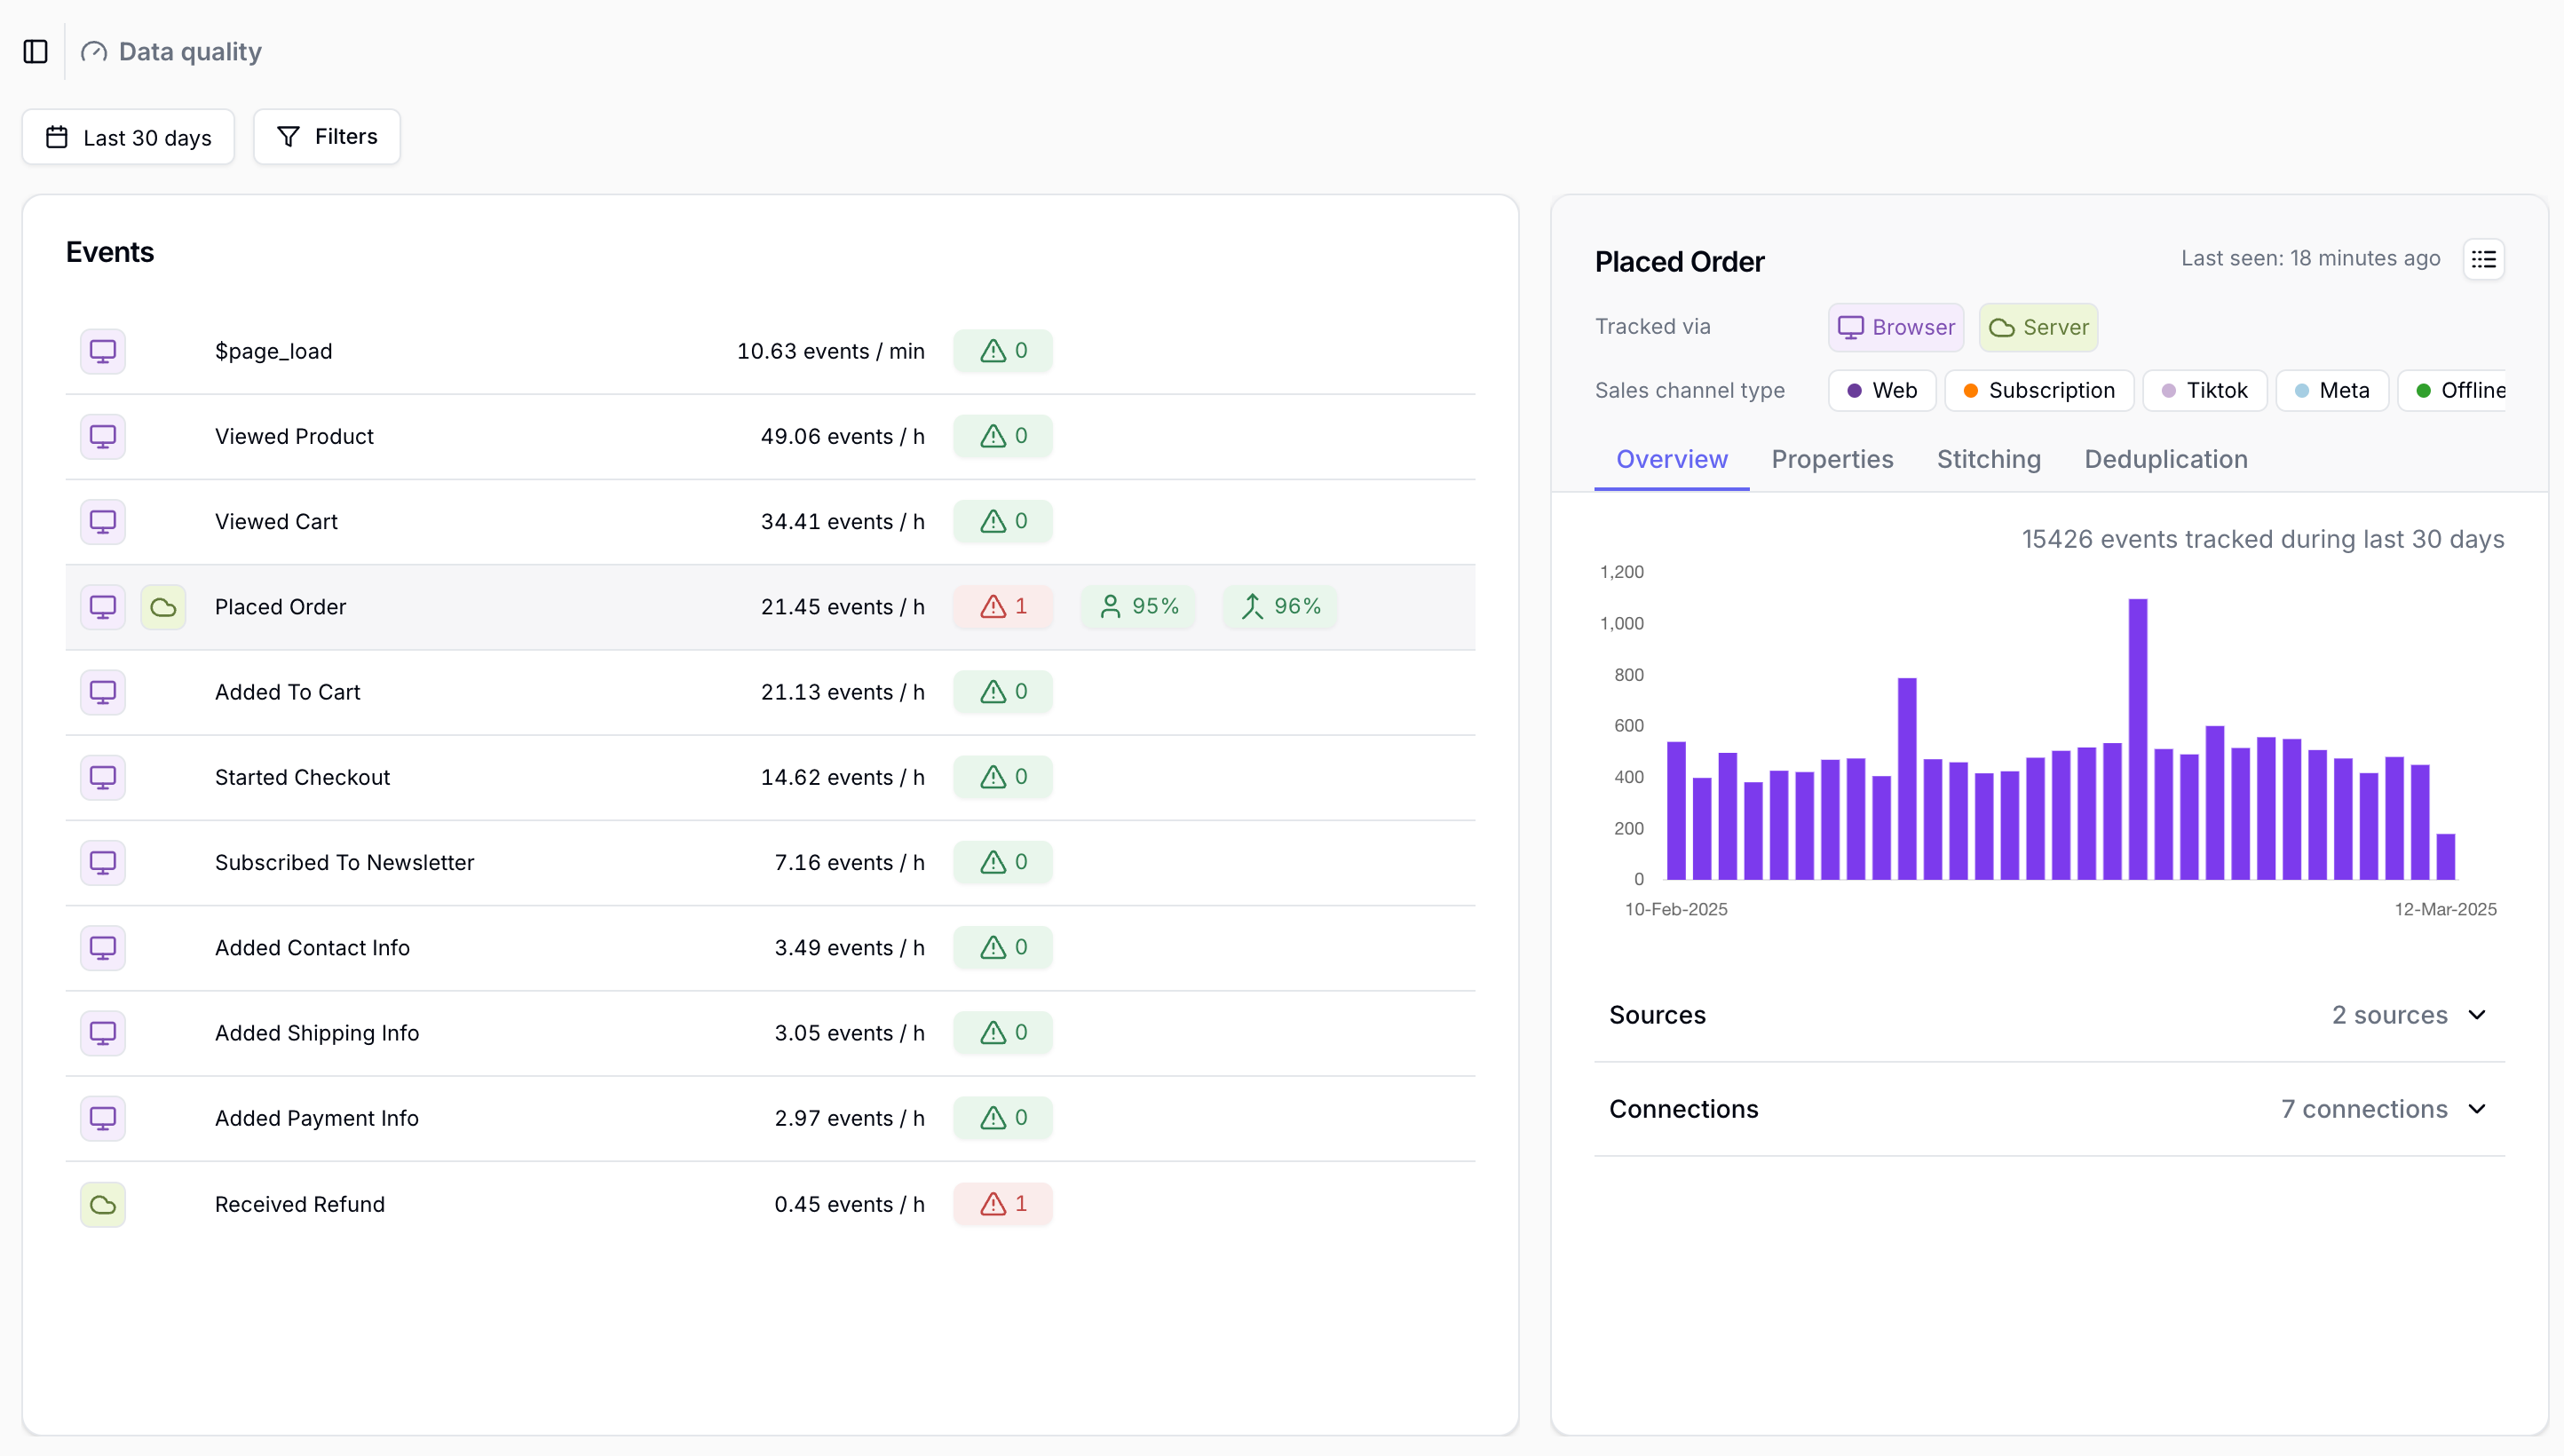
The Data quality page helps you monitor the quality of data sent to Converge. It flags issues that might impact your reports or configured destinations. The Data quality page consists of two main sections:Documentation Index
Fetch the complete documentation index at: https://docs.runconverge.com/llms.txt
Use this file to discover all available pages before exploring further.
- Events overview (left): Displays all tracked events within the selected time period.
- Event details (right): Shows detailed warnings and information for a selected event.
The Data quality report only covers data from the past 3 months.
Events overview
The Events overview lists all events tracked from any of your event sources within the selected time period. For each event, you’ll see:- Tracking method: How the event was tracked. Through a browser or server-side source or both.
- Event name: The name of the event as it was sent to Converge.
- Frequency: The average amount the event has been tracked each hour.
- Property warnings: A warning indicating issues with the event properties that could affect report accuracy or how events are sent to destinations.
- Stitching percentage: Percentage of server-side events that have been successfully stitched to web sessions. Read more about stitching percentage and why it matters here.
- Deduplication percentage: The percentage of deduplicated events if sent through browser and server-side sources both. Read more about deduplication percentage and why it matters here.

Event details
After selecting an event in the Events overview, you’ll see the details about it in the right pane. At the top of this section, you’ll find the following information:- Tracking method: The method used to track the events. This can be a browser or server source, or both.
- Sales channel: Which sales channels are used for the tracked events.

Overview
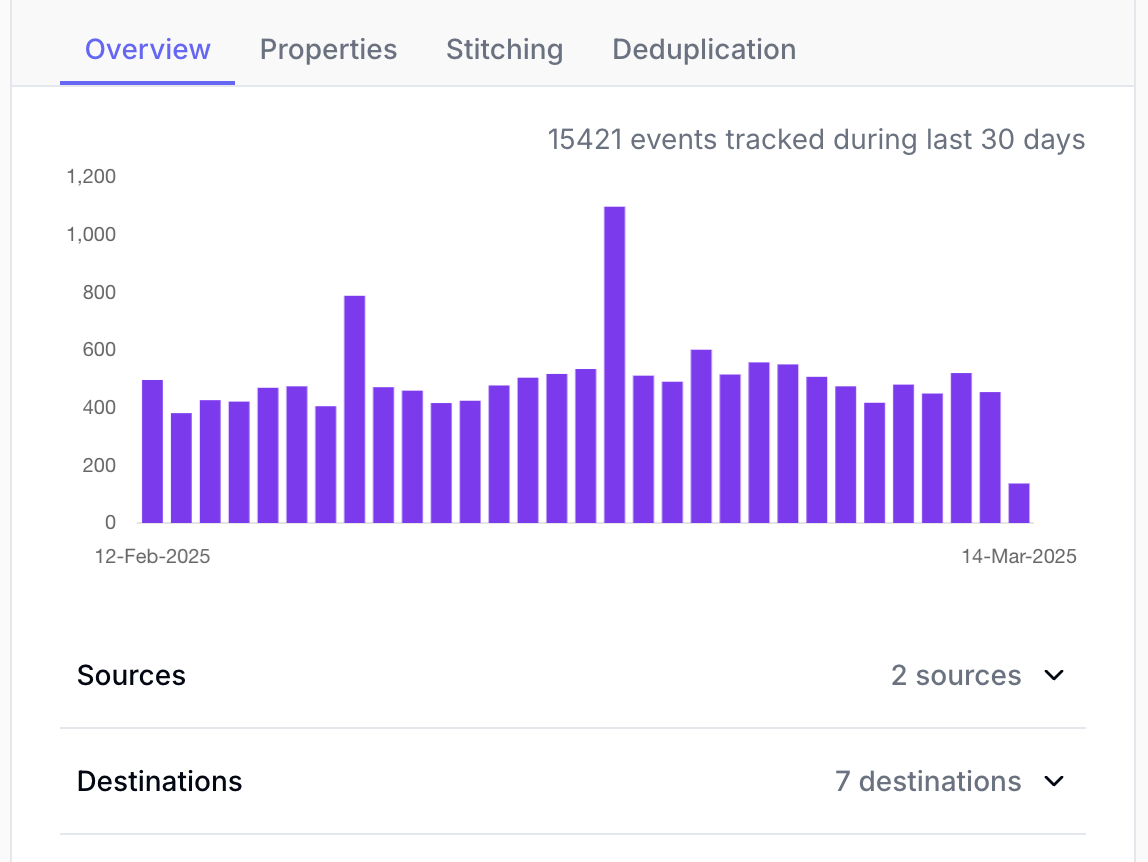
In the Overview tab you’ll find the following details:- Events tracked: A graph showing how many events you have tracked per day.
- Sources: A tab showing the sources through which the events were tracked.
- Destinations: A tab showing the destinations which received the events.
Properties
In the properties tab, you’ll see all the properties sent with the event at the profile, session, and event levels. If there are any issues with the properties, a warning will appear. Clicking on the warning provides an overview of the detected issues and how often they occurred within the selected time period. By clicking on the arrow in the top right of each warning you will be sent to the filtered event logs showing the individual events which have incorrect values.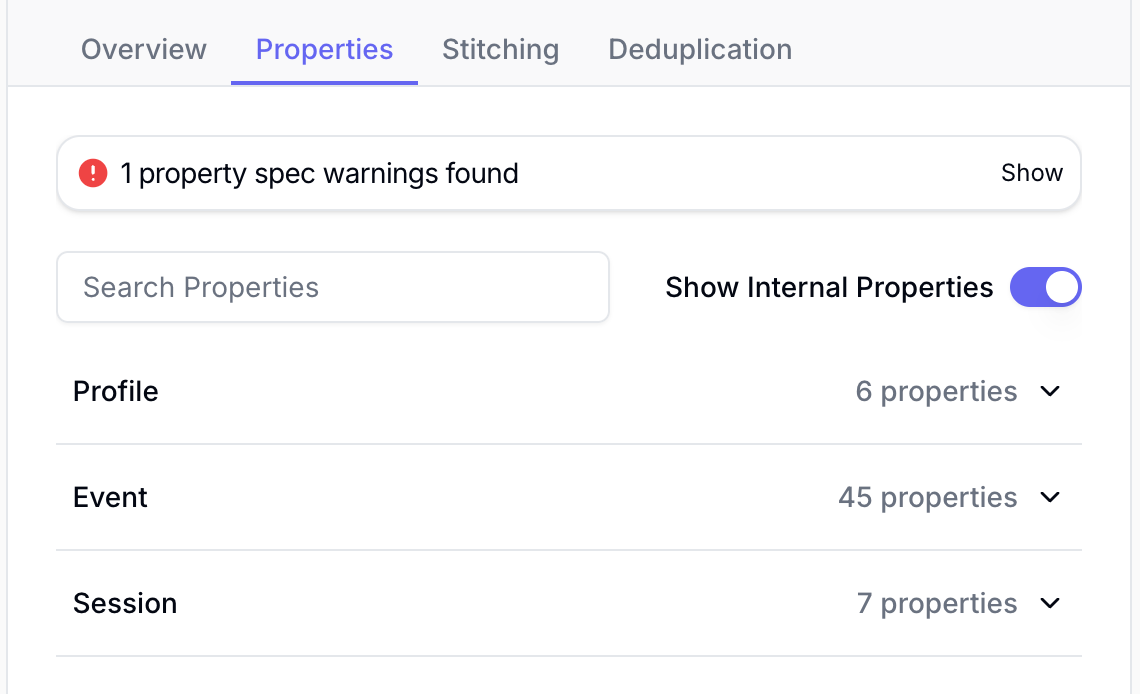
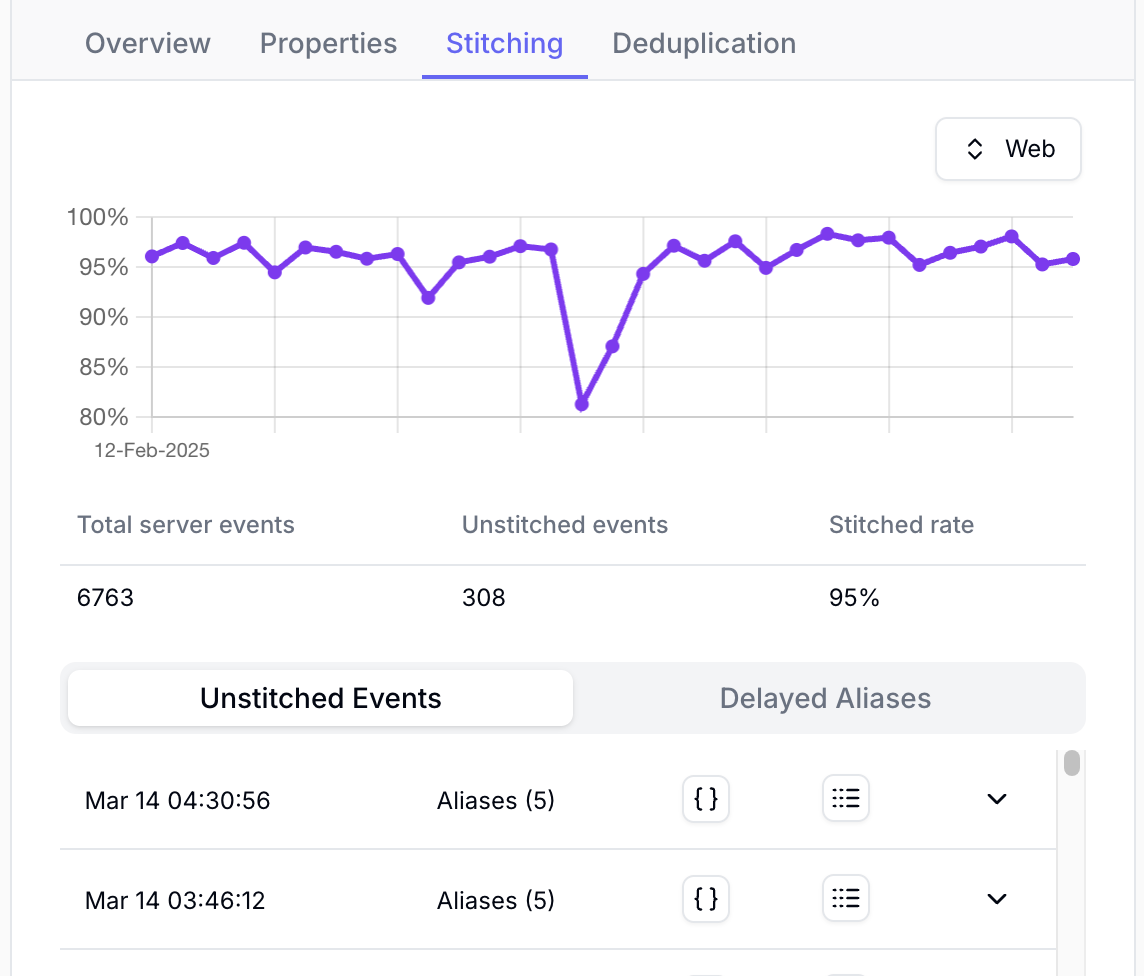
Stitching
To attribute server-side tracked events and enrich them with browser data, Converge must link these events to a corresponding web session tracked via a browser-based source, such as the Converge JS tracking pixel.You can find more information about how Converge uses aliases to stitch browser and server events together in
our Aliases documentation.
- Events per day: A graph displaying the stitching rate per day.
- Stitching metrics: A table showing the number of server events received, unstitched events, and the stitching rate.
- Unstitched events: A detailed view of individual unstitched events, including the aliases sent to Converge, event properties, and a
link to a filtered event log for reviewing the specific event. - Delayed events: A list of delayed aliases, showing server events that Converge couldn’t stitch at the time of receipt but stitched later.
These events were already sent to your destinations with potentially limited data but will be properly attributed in Converge reporting.
Deduplication
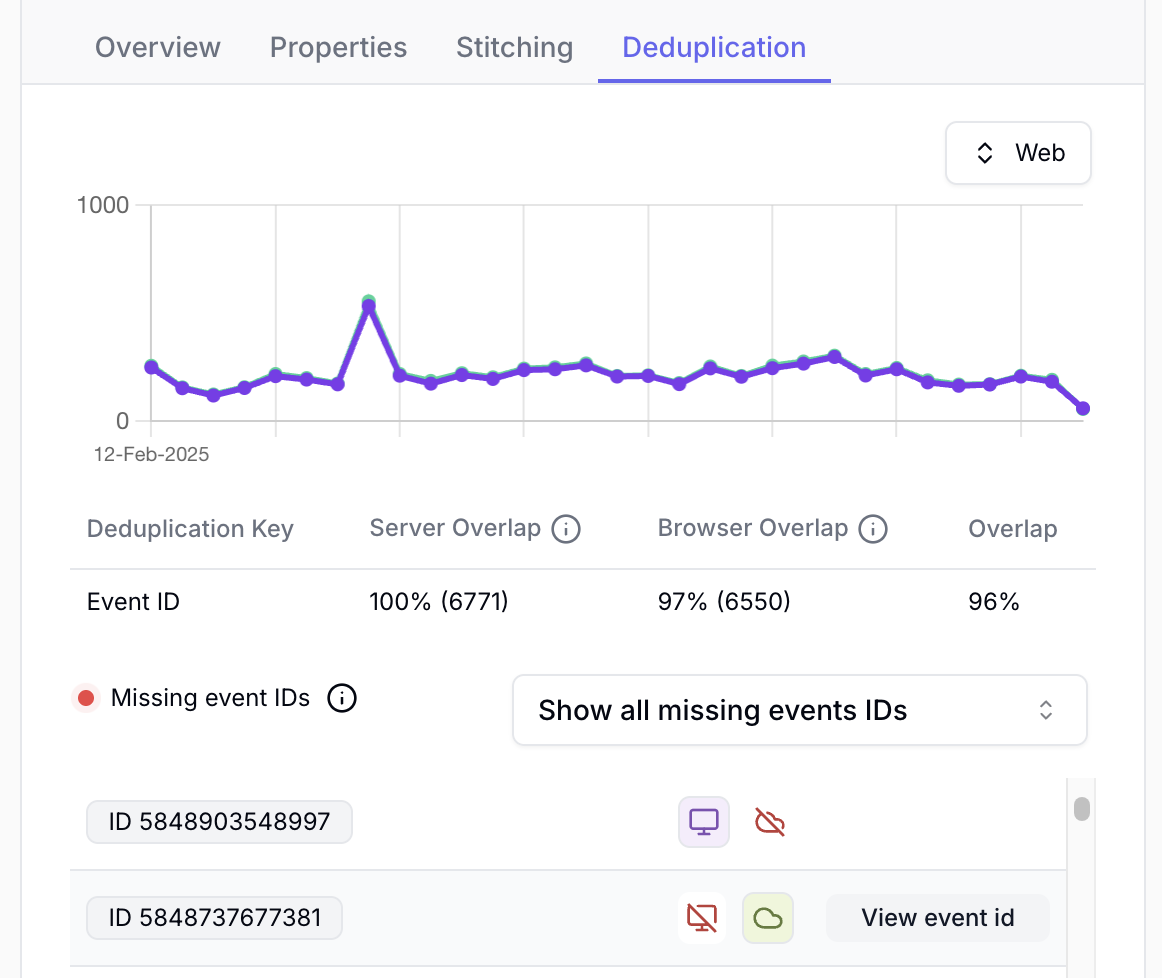
If you are sending an event through both a server-side and browser-side event source, Converge will need to deduplicate these events to avoid duplicate tracking in Converge or your destinations.You can find more information about how Converge uses event IDs to deduplicate browser and server events in
our Deduplication documentation.
- Events tracked: A graph showing how many events you have tracked through server and browser per day.
- Deduplication metrics: A table showing the overlap of server and browser events per deduplication key.
- Missing event IDs: A list of all the events which are either missing a matching server-side or browser-side event.
