The Event Logs only covers data from the past 3 months.
Overview
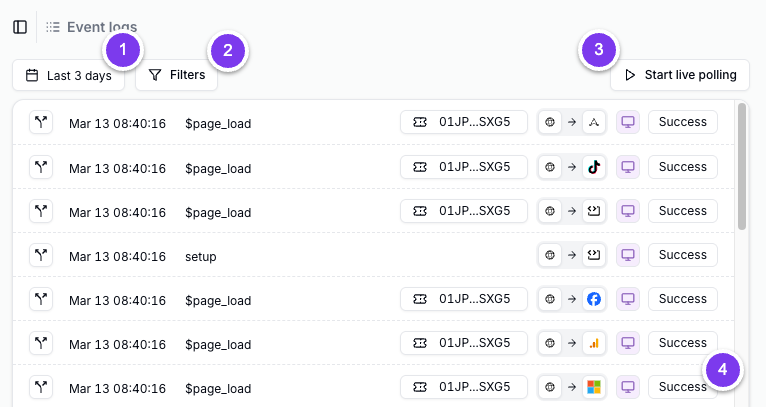
In the Event Logs you’ll find the following sections:- Date Picker: A date picker to select a date range in which you want to see your events.
- Filters: Filters you can use to view a specific subset of your events.
- Live polling: A button to start live polling new events directly when they come in.
- Events Overview: An overview of all the events matching your selected date range and filters.
Log types
The Event Logs showcase different log types:- Tracked: the events which are tracked in Converge.
- Browser Passthrough: Browser-side events that are only used for client-side forwarding and don’t get tracked.
- Destination: Forwarded events sent to your destinations based on Tracked and Browser Passthrough events.
- Property Spec Warning: Events with warnings for one or more properties sent with the event.
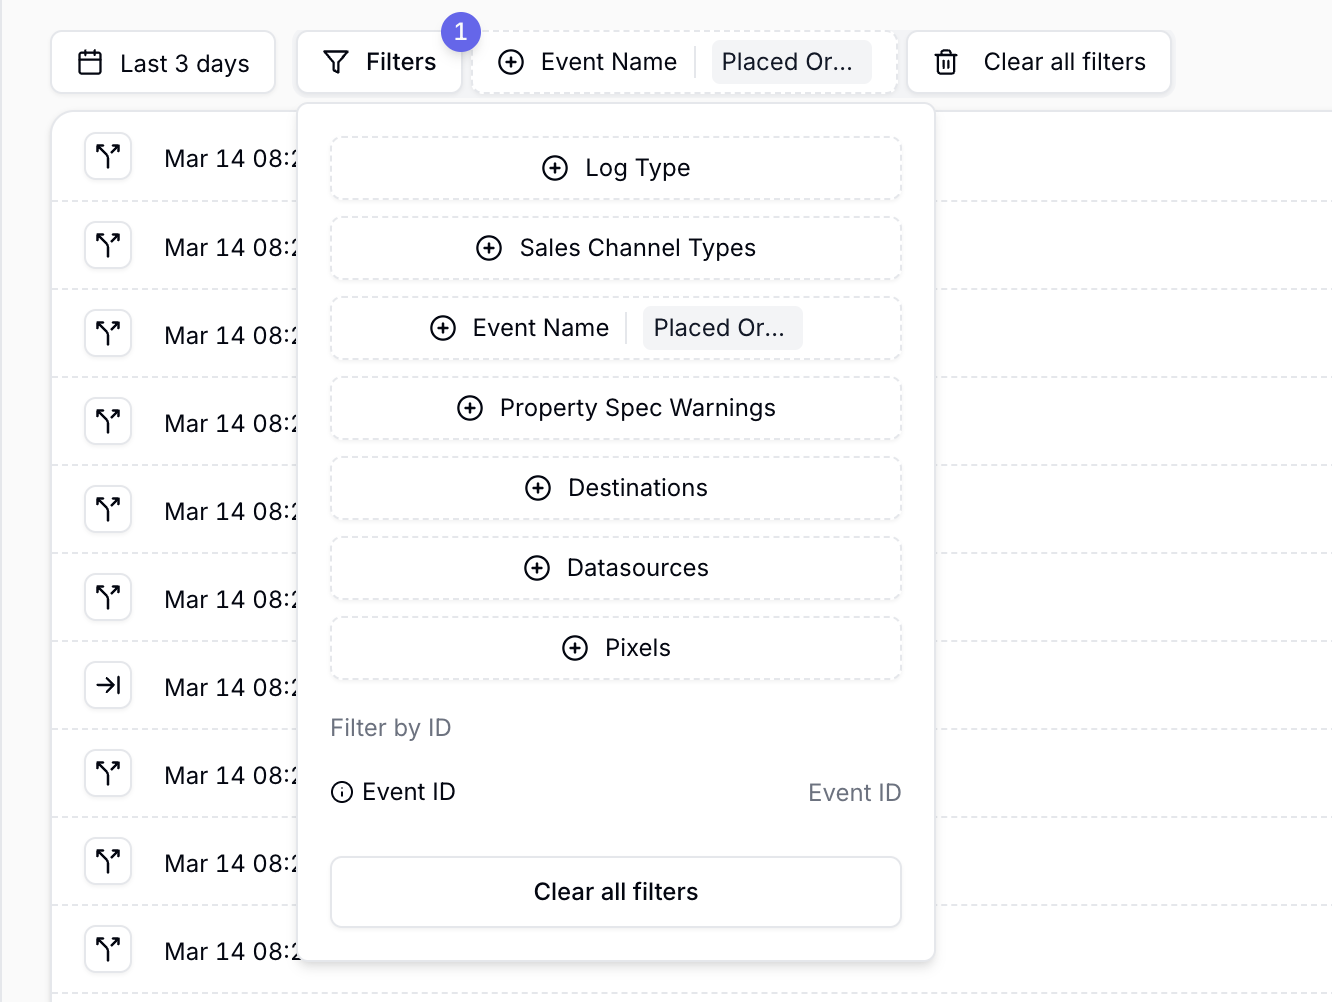
Filters
Use filters to view a specific subset of events. Combine multiple filters to show only the events you need.Click the Filters button to access the following options:
- Log type: Filter by log types as described here.
- Sales channel types: Filter by the sales channel of your events.
- Event name: Filter by event names.
- Property spec warnings: Filter by property warnings in your events.
- Destinations: Filter by the destinations where an event was forwarded.
- Datasources: Filter by server-side event sources.
- Pixels: Filter by browser-side event sources.
- Event ID: Filter by unique event IDs.
Click a filter to change its values or remove it. To remove all filters, click Clear all filters.
Event log lines
In the Event Logs, the log shows you different kinds of information based on the log type.Tracked
Tracked
For each Tracked event you will see the following information in the overview:
- Event type: The type of event: Tracked.
- Event time: The time the event was received.
- Event name: The name of the event.
- Event ID: The unique Event ID.
- Sales channel: The sales channel of the event.
- Event source: The source of the event.
Browser Passthrough
Browser Passthrough
For each Browser Passthrough event you will see the following information in the overview:
- Event type: The type of event: Browser Passthrough.
- Event time: The time the event was received.
- Event name: The name of the event.
- Event ID: The unique Event ID.
- Sales channel: The sales channel of the event.
- Event source: The source of the event.
Destination
Destination
For each Destination event you will see the following information in the overview: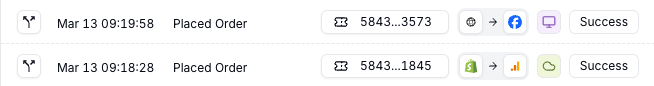
- Event type: The type of event: Destination.
- Event time: The time the event was received.
- Event name: The name of the event triggering the forward.
- Event ID: The unique Event ID.
- Event source: The source of the event.
- Event destination: The destination of the event.
- Forwarding method: The forwarding method of the event, either browser or server.
- Forwarding status: The status of the forwarded event.
Property Spec Warning
Property Spec Warning
For each Property Spec Warning event you will see the following information in the overview:
- Event type: The type of event: Property Spec Warning.
- Event time: The time the event was received.
- Event name: The name of the event.
- Event ID: The unique Event ID.
- Sales channel: The sales channel of the event.
- Event source: The source of the event.
- Warning: The type of warning.
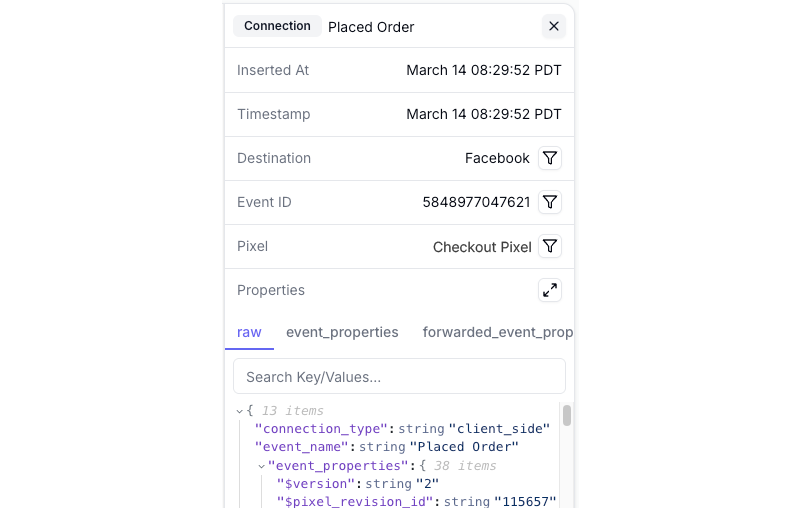
Log details
After clicking on a specific log entry, the log details are shown in the right pane of the Event Logs. For each log you’ll find the following:- Log type: The log type the event is from.
- Event name: The name of the event.
- Inserted At: The date and time the event was received by Converge.
- Timestamp: The date and time the event was created according to its source.
- Destination: The destination the event was forwarded to. (Destination log type only)
- Event ID: The unique event ID.
- Pixel: The browser-side event source of the event.
- Datasource: The server-side event source of the event.
- Property warnings: Warnings about issues with specific properties.
- Properties: All the event properties after processing by Converge.
 icon on the right.