What is an insight
Insights are the main building block of your custom marketing analytics. They allow you to visualize customer events, ad platform metrics, and first-party attribution metrics, and analyze how you acquire customers.How to create your first insight
-
From the sidebar click on Insightsand click on Create new Insight.
-
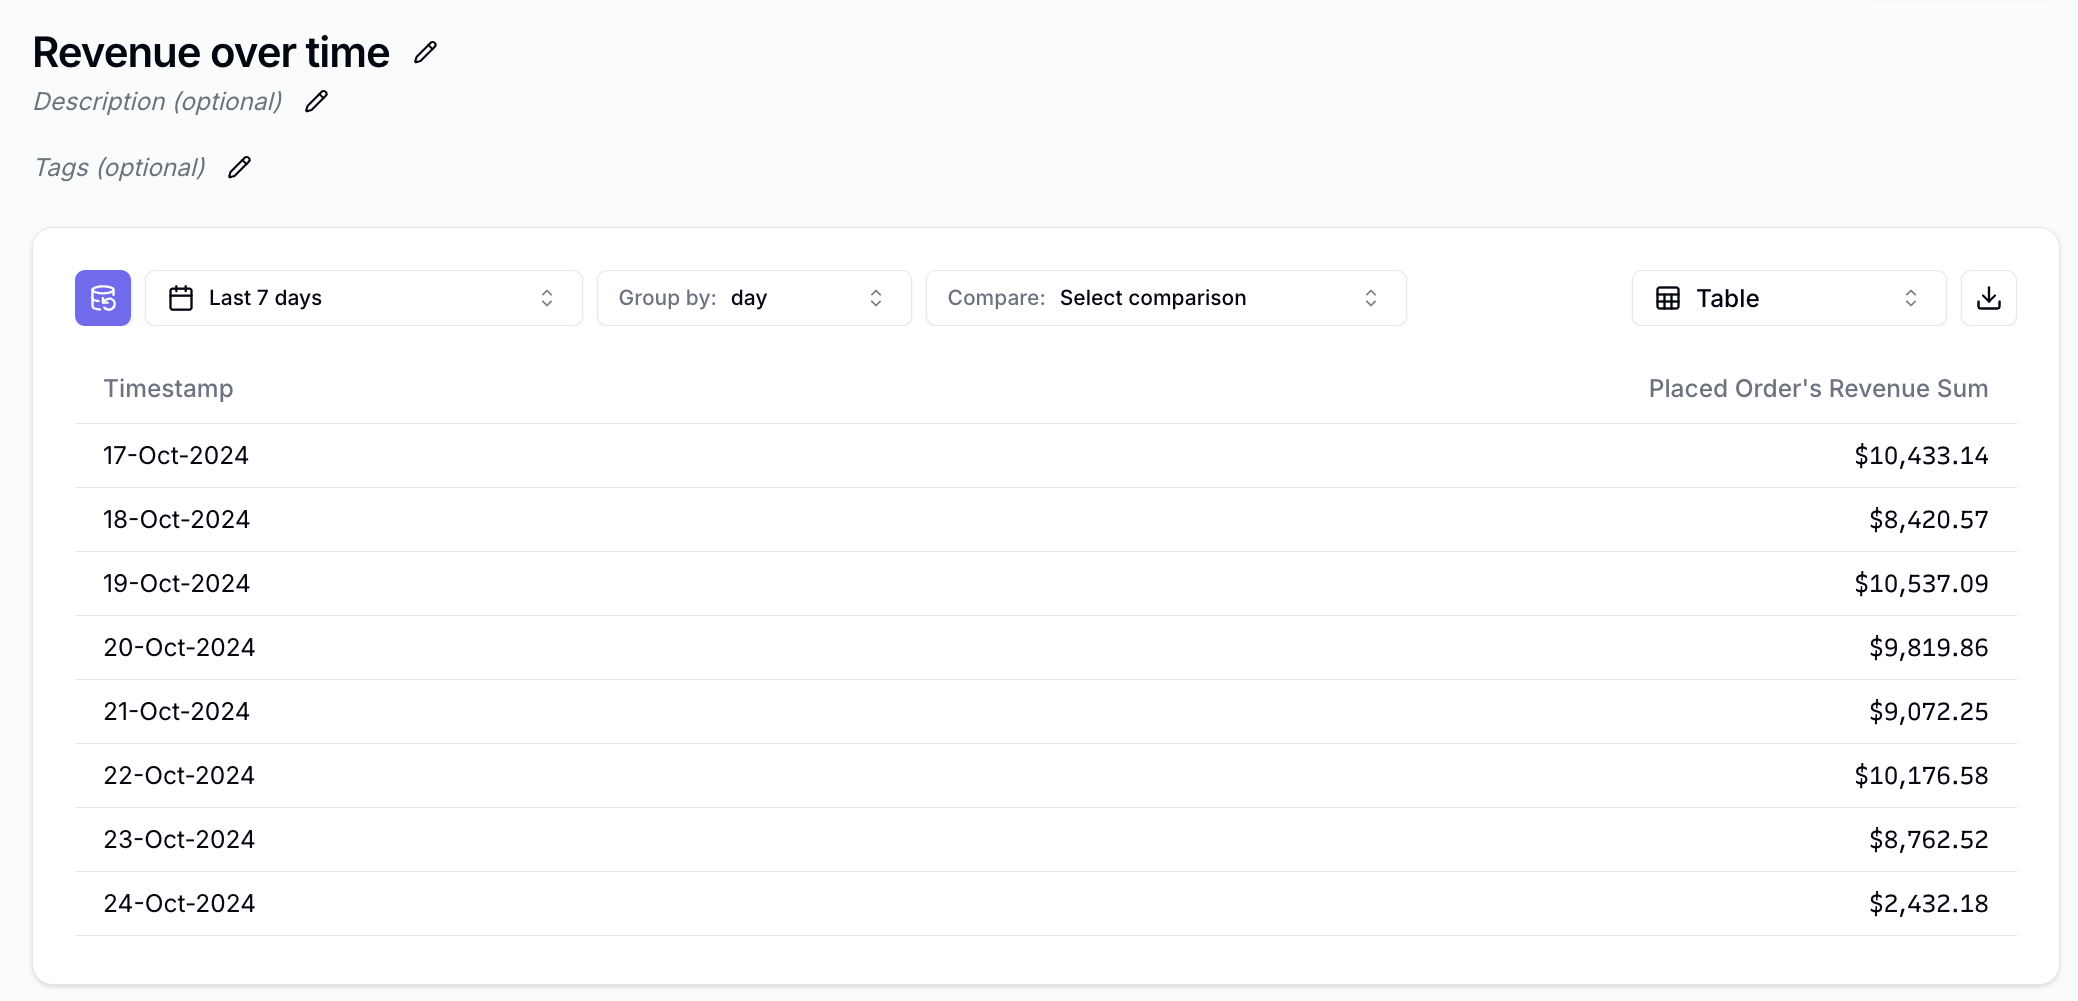
This will open the query builder, click on the -icon next to “Unnamed insight” and give it a name, e.g.
Revenue over time.
- Click on the -icon to save the new name.
-
Click on Add metric
-
Click on Revenue
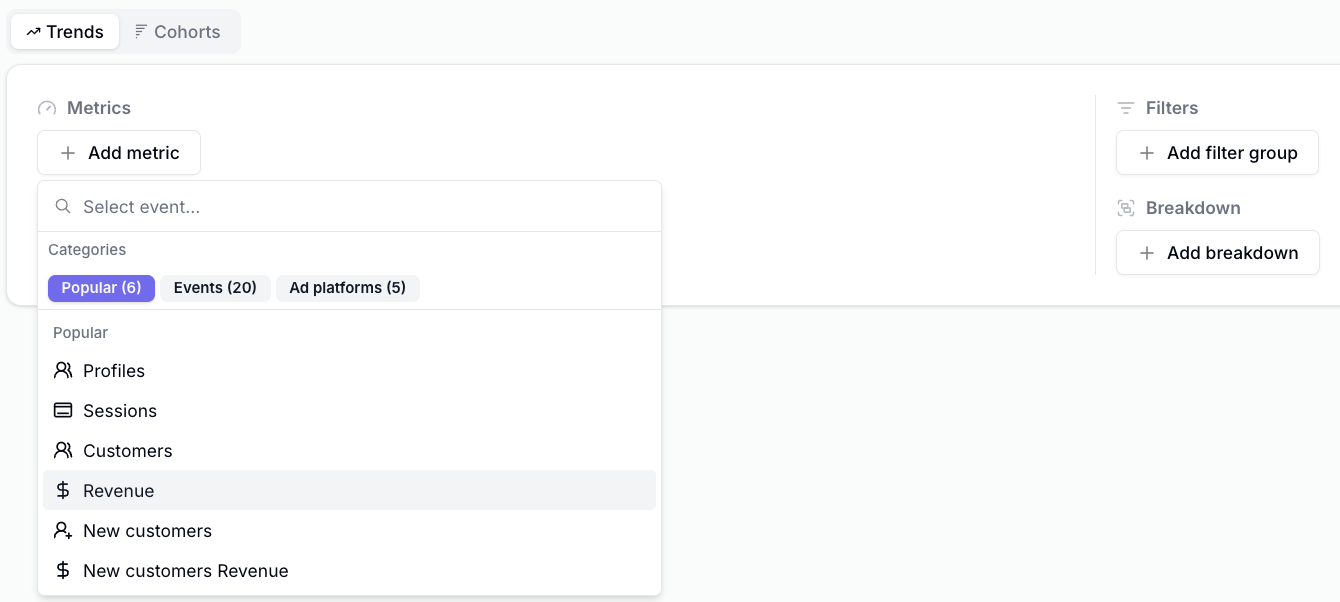
-
Click on Create insightin the top right corner.
-
You’ve created your first insight.
Insight Building Blocks
Insights are extremely flexible, you can configure the exact insight you want across these dimensions:- Metrics: Choose which values you’d like to display
- Visualization Types: Insights can show up as tables, line charts, pie charts, etc.
- Filters: You can flexibly filter in or out based on session, event, attribution, or ad platform properties
- Breakdowns: You can break down insights across session, event, attribution, or ad platform properties
- Cohorts: We support specific cohort-based insights