Introduction
When configuring attribution in Converge, you make these choices:- Window: How far back to look for touchpoints that should receive credit for a conversion (e.g., 1 day, 7 days, 90 days).
- Model: How to distribute credit across the touchpoints in a customer journey (e.g., first touch, last touch, linear).
- Mode: When to assign credit; at the time of the click on the ad (click time) or at the time of conversion (conversion time).
- Lookback window (Click time mode only): How many days after a touchpoint a conversion is still counted toward that touchpoint’s credit. Used to compare recent periods fairly before the full attribution window has elapsed. See Lookback window.
Example
Consider a customer journey where a prospect clicks a Snapchat ad, then a Meta ad, then a Google Search ad before purchasing: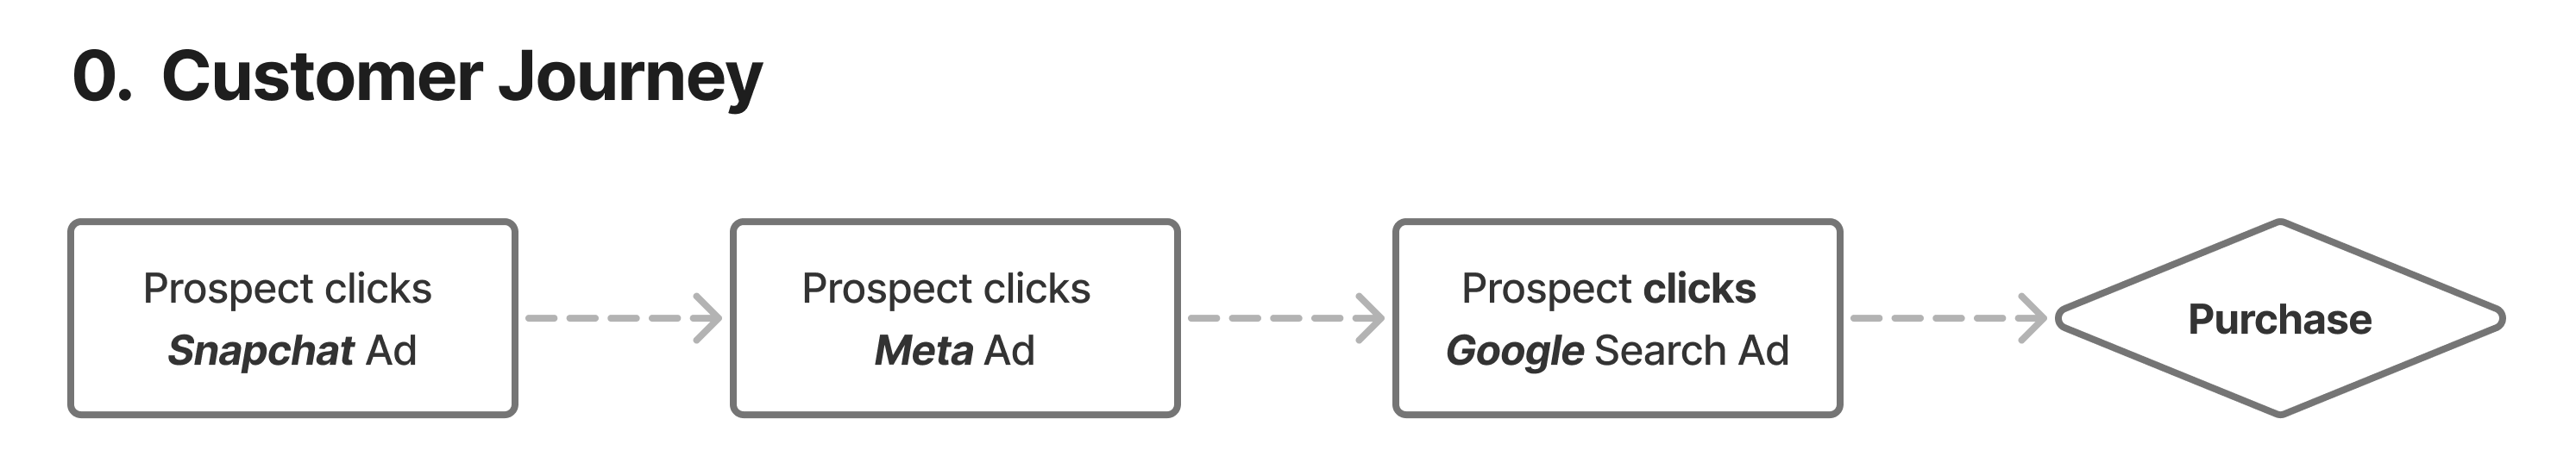
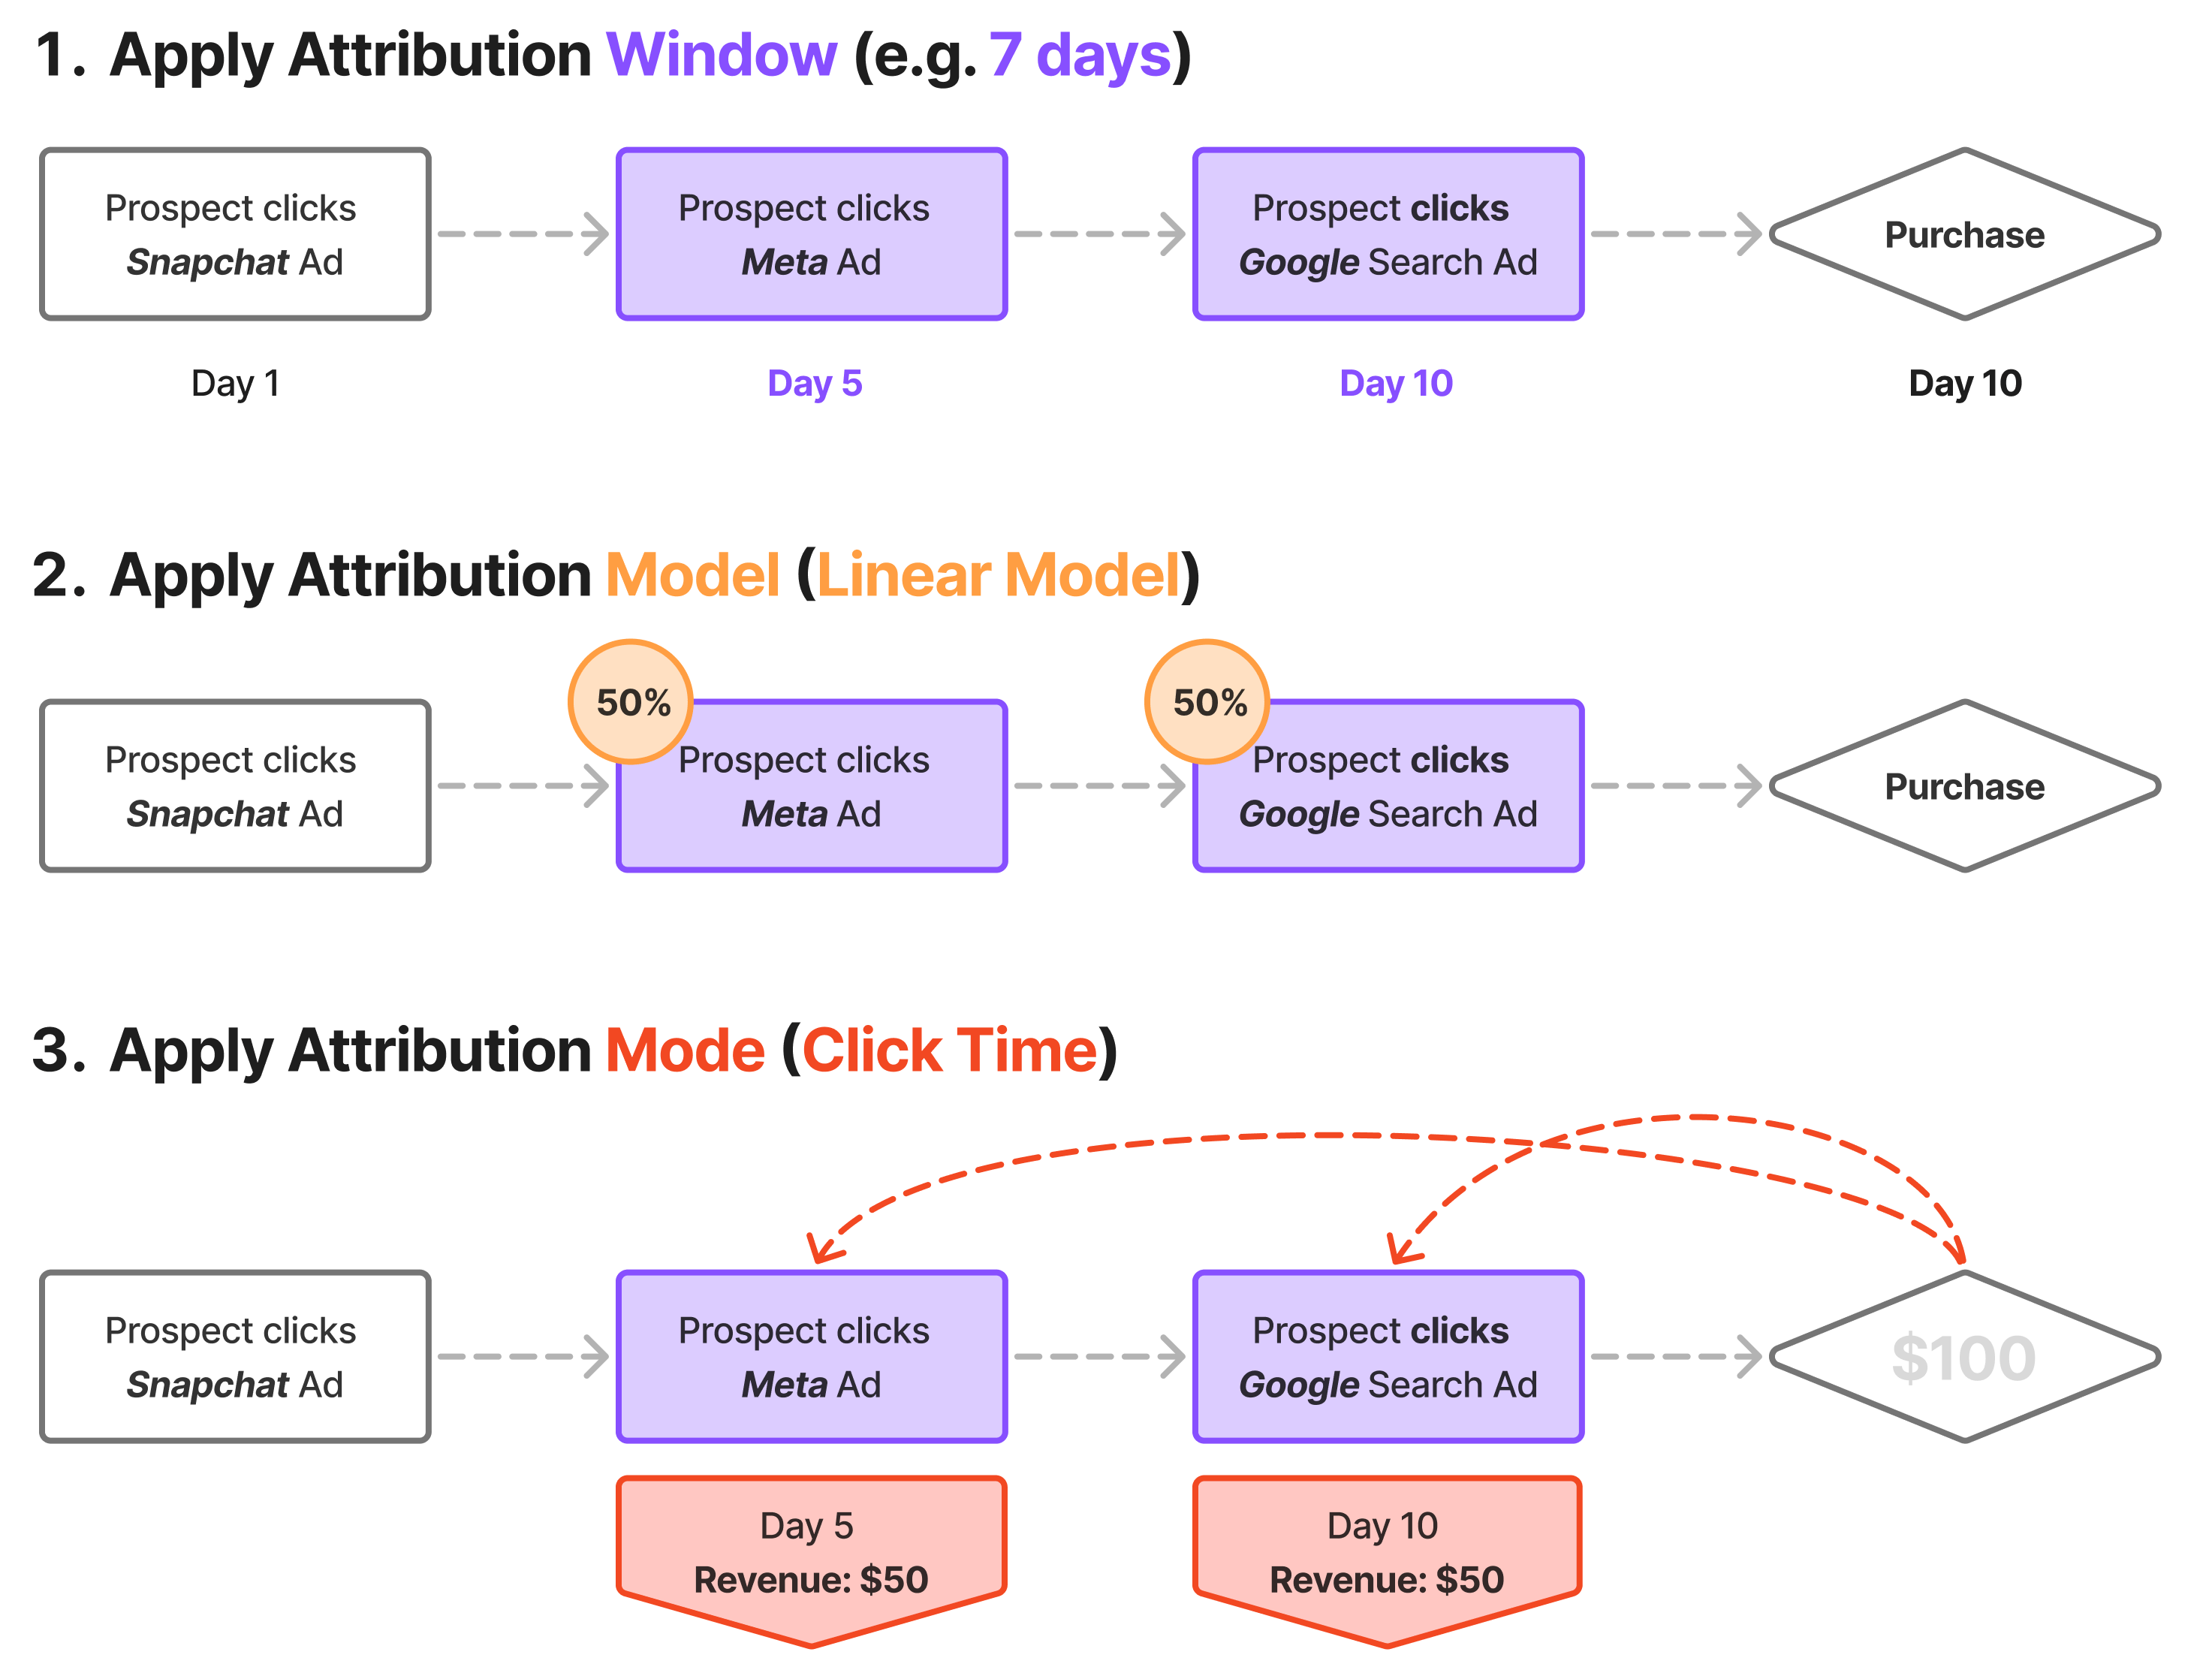
- Apply attribution window (e.g. 7 days): Filter out touchpoints outside the window. Since the Snapchat click happened on Day 1 (outside a 7-day window from the Day 10 conversion), only the Meta and Google clicks qualify.
- Apply attribution model (e.g., Linear): Distribute credit across qualifying touchpoints. With a Linear model, the Meta and Google clicks each receive 50% credit.
- Apply attribution mode (e.g., Click time): Assign when revenue credit is recorded. With Click time attribution, the $100 purchase is split: $50 credited to Day 5 (Meta click) and $50 to Day 10 (Google click).
- Apply lookback window (Click time mode only): Optionally drop credit from touchpoints whose conversion arrived too long after them. For example, with a 4-day lookback, the Meta click’s $50 is dropped from the total (the conversion arrived 5 days later), while the Google click’s $50 is kept. Defaults to the Full window (equivalent to the attribution window). See Lookback window.
Overview table
The overview table shows how different models attribute a conversion journey with four different (non-direct) touchpoints.
* The Time decay and Inverse time decay models consider the time between touchpoints, which isn’t shown in the simplified table above.
Read more about the Time decay model here.
All attribution models except Direct skip direct touchpoints whenever a non-direct touchpoint is available in the journey. If the entire journey is direct, they fall back to the direct session.For example, in this customer journey:
Facebook > Direct > Google > Direct > Conversion, the last touch model attributes the entire conversion to Google,
while a linear model attributes 50% to Facebook and 50% to Google.This is why numbers can differ meaningfully between the Direct model and all other models. If many of your conversions come through direct sessions (for example, repeat visitors who navigate straight to your site), non-direct models will attribute those conversions to an earlier non-direct touchpoint, while the Direct model attributes them to Direct.Attribution window
The attribution window determines how far back Converge looks for touchpoints that should receive credit for a conversion. Converge offers fixed attribution window options: 1 day, 3 days, 7 days, 14 days, 30 days, or 90 days. Example: A customer has touchpoints on January 1st, January 2nd, and January 3rd, then converts on January 4th.- With a 1-day attribution window, only the January 3rd touchpoint receives credit (it’s within 1 day of the conversion).
- With a 7-day attribution window, all three touchpoints receive credit (they’re all within 7 days of the conversion).
Attribution mode
The attribution mode determines when conversion and revenue credit are given. There are two modes: Click time: Credit is given at the touchpoint time. For example, if a user clicks a Facebook ad on January 1st and converts on January 5th, the conversion credit is attributed to January 1st. Conversion time: Credit is given at the transaction time. Using the same example, the conversion credit would be attributed to January 5th.Lookback window
The lookback window only applies in Click time mode. It has no effect in Conversion time mode.
- With a Full window lookback (the default), all three touchpoints receive credit.
- With a 7-day lookback, only the January 5th and January 8th touchpoints receive credit. The conversion arrived 9 days after the January 1st touchpoint — its share is dropped from the total rather than redistributed to the others.
Because the lookback window only removes conversions from the total and never redistributes credit, totals with a shorter lookback window will be lower than totals with the full window. This is by design: only attribution that has had time to settle is counted.
Attribution models
Direct
Description: All credit goes to the channel of the session where the conversion occurred. Use case: Understand which channel drove the conversion session.The Direct model is the only model that uses the actual session in which the conversion happened, including direct sessions. All other models skip direct touchpoints whenever a non-direct touchpoint is available (see the note above).For example, with this customer journey:
Facebook-session >Google-session >Direct-session with conversion
Direct, while the last touch model attributes it to Google.First touch
Description: All credit goes to the first touchpoint Converge observed in this customer journey. This touchpoint can be either a paid channel (e.g. Facebook) or a non-paid channel (e.g. Organic Search). Use case: Check how channels contribute to acquiring prospective customers. Example for 4 touchpoints:First touch paid only
If no paid touchpoint can be found, then the conversion will be attributed to No web touchpoint.
Last touch
Description: All credit goes to the last touchpoint Converge observed in this customer journey. This touchpoint can be either a paid channel (e.g. Facebook) or a non-paid channel (e.g. Organic Search). Use case: Check how channels contribute to converting prospects into customers. Example for 4 touchpoints:Last touch paid only
If no paid touchpoint can be found, then the conversion will be attributed to No web touchpoint.
Linear
Description: Conversions are evenly attributed to all touchpoints in this customer journey. For example, with 2 touchpoints each would receive 50% credit and with 3 touchpoints each would receive 33.3%. Use case: Check how channels contribute to the complete customer journey to conversion. Example for 4 touchpoints:Top of funnel
If no top of funnel touchpoints are found, the model will fall back to a linear distribution across all touchpoints. If no touchpoints can be found at all, then the conversion will be attributed to No web touchpoint.
- Paid touchpoints from these channels: paid search, paid social, paid video, paid shopping, and display.
- Only touchpoints whose campaign name does not indicate “brand” (unless “non brand” or “NB” is present).
- Any unpaid touchpoints (e.g., organic, direct).
- Paid touchpoints with a campaign name containing “brand”, “brd”, or “SR” (unless the phrase includes “non brand” or “NB”).
Only paid, non-branded touchpoints are counted for attribution.
In this example:
- “Summer Promo Search” and “Social Media Blast” are both paid and non-branded, so each receives 50% of the credit.
- “Brand Awareness Search” and “Brand Display” are excluded from attribution because their campaign names contain brand-related terms (“brand”).
- “Organic Blog Visit” is not a paid touchpoint, so it gets 0%.
Participation
It is normal for a participation model to show more attributed conversions than there are actual conversions because it will attribute the same conversion to multiple channels
J-shaped
Description: Conversions are attributed across all touchpoints but biased more towards the last touch. For 3 or more touchpoints, 60% of the credit is attributed to the last touch, 20% to the first touch, the remaining 20% is evenly distributed between the remaining touchpoints. For 2 touchpoints, 75% is credited to the last touch and 25% to the first touch. Use case: Use as your main model if you prefer Last touch attribution but want other touchpoints (especially first touch) to contribute. Example for 4 touchpoints:J-shaped paid only
If no paid touchpoint can be found, then the conversion will be attributed to No web touchpoint.
Inverse J-shaped
Description: Conversions are attributed across all touchpoints but biased more towards the first touch. For 3 or more touchpoints, 60% of the credit is attributed to the first touch, 20% to the last touch, the remaining 20% is evenly distributed between the remaining touchpoints. For 2 touchpoints, 75% is credited to the first touch and 25% to the last touch. Use case: Use as your main model if you prefer first touch attribution but want other touchpoints (especially last touch) to contribute. Example for 4 touchpoints:Inverse J-shaped paid only
If no paid touchpoint can be found, then the conversion will be attributed to No web touchpoint.