Introduction
Converge offers multiple reporting options to analyze data from your Event sources and Marketing sources.Insights and Dashboards require a separate license. Contact your Converge rep for access.
Overview report
The Overview Report gives you a quick look at your key metrics. It includes:- Blended: Metrics based on all your connected sources.
- Platforms: In-platform metrics from each marketing source.
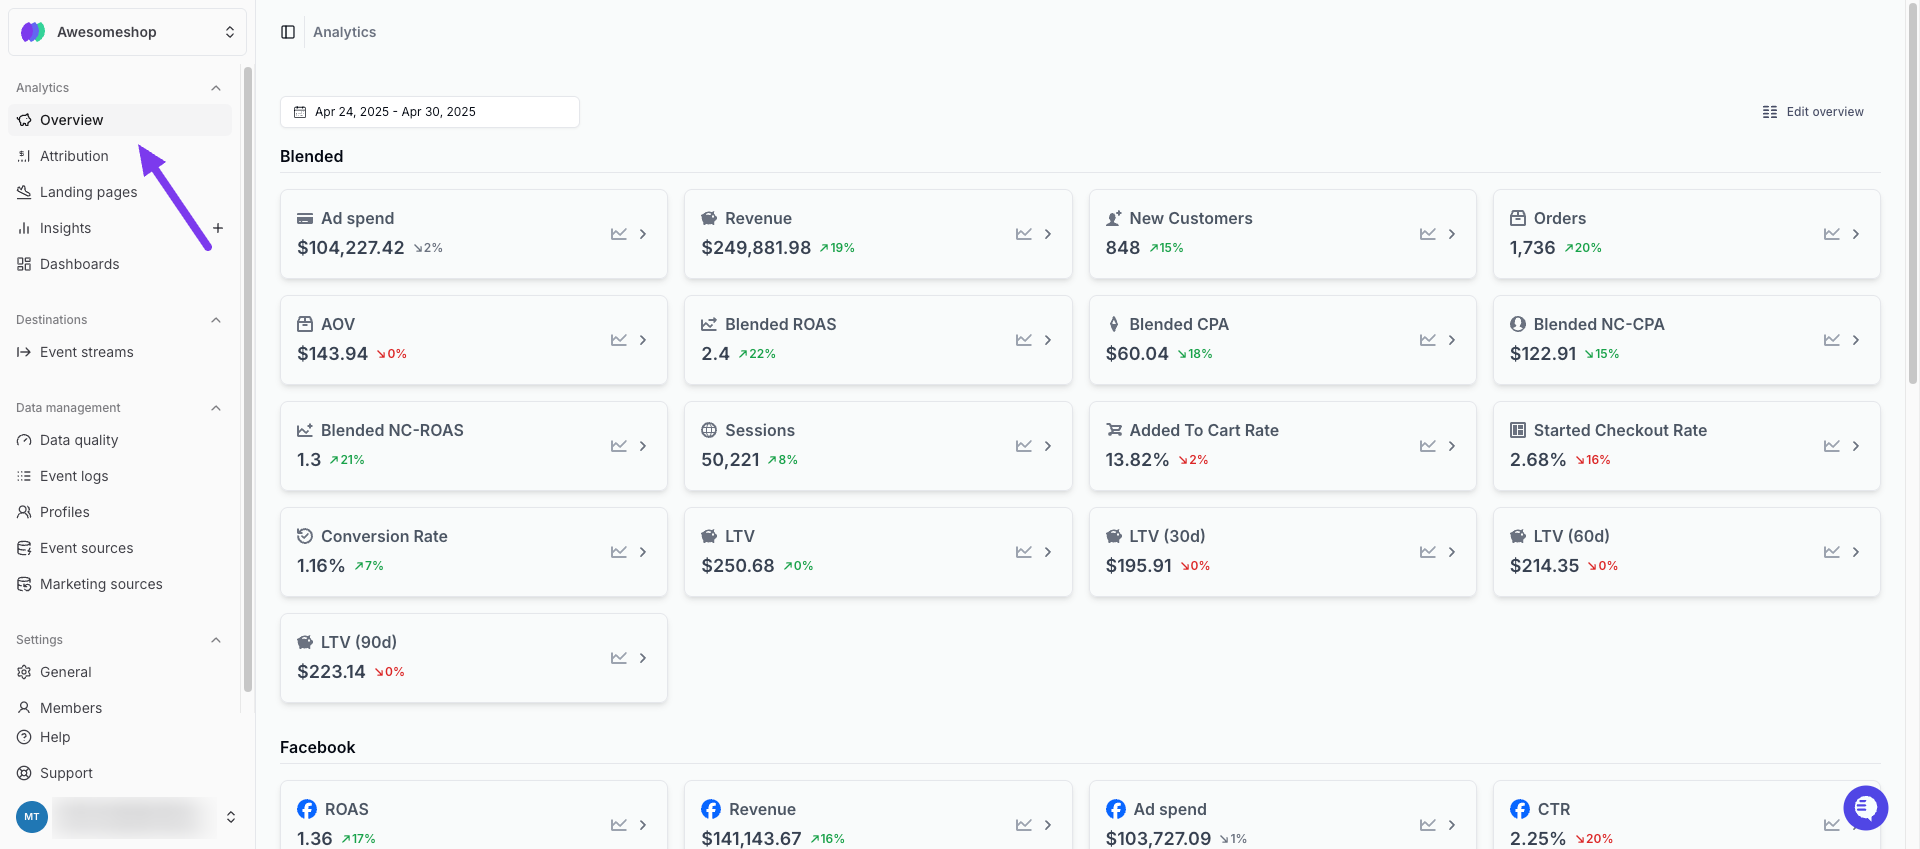
Overview Report
Pacing Sheet
Many merchants use separate daily spreadsheets to track their core metrics, but these spreadsheets are not real-time and are prone to data entry errors. The Pacing Sheet replaces your daily spreadsheet with up-to-date, accurate data directly from Converge, helping you to spot trends and anomalies. It includes:- Blended: Metrics based on all your connected sources.
- Platforms: In-platform metrics from each marketing source.
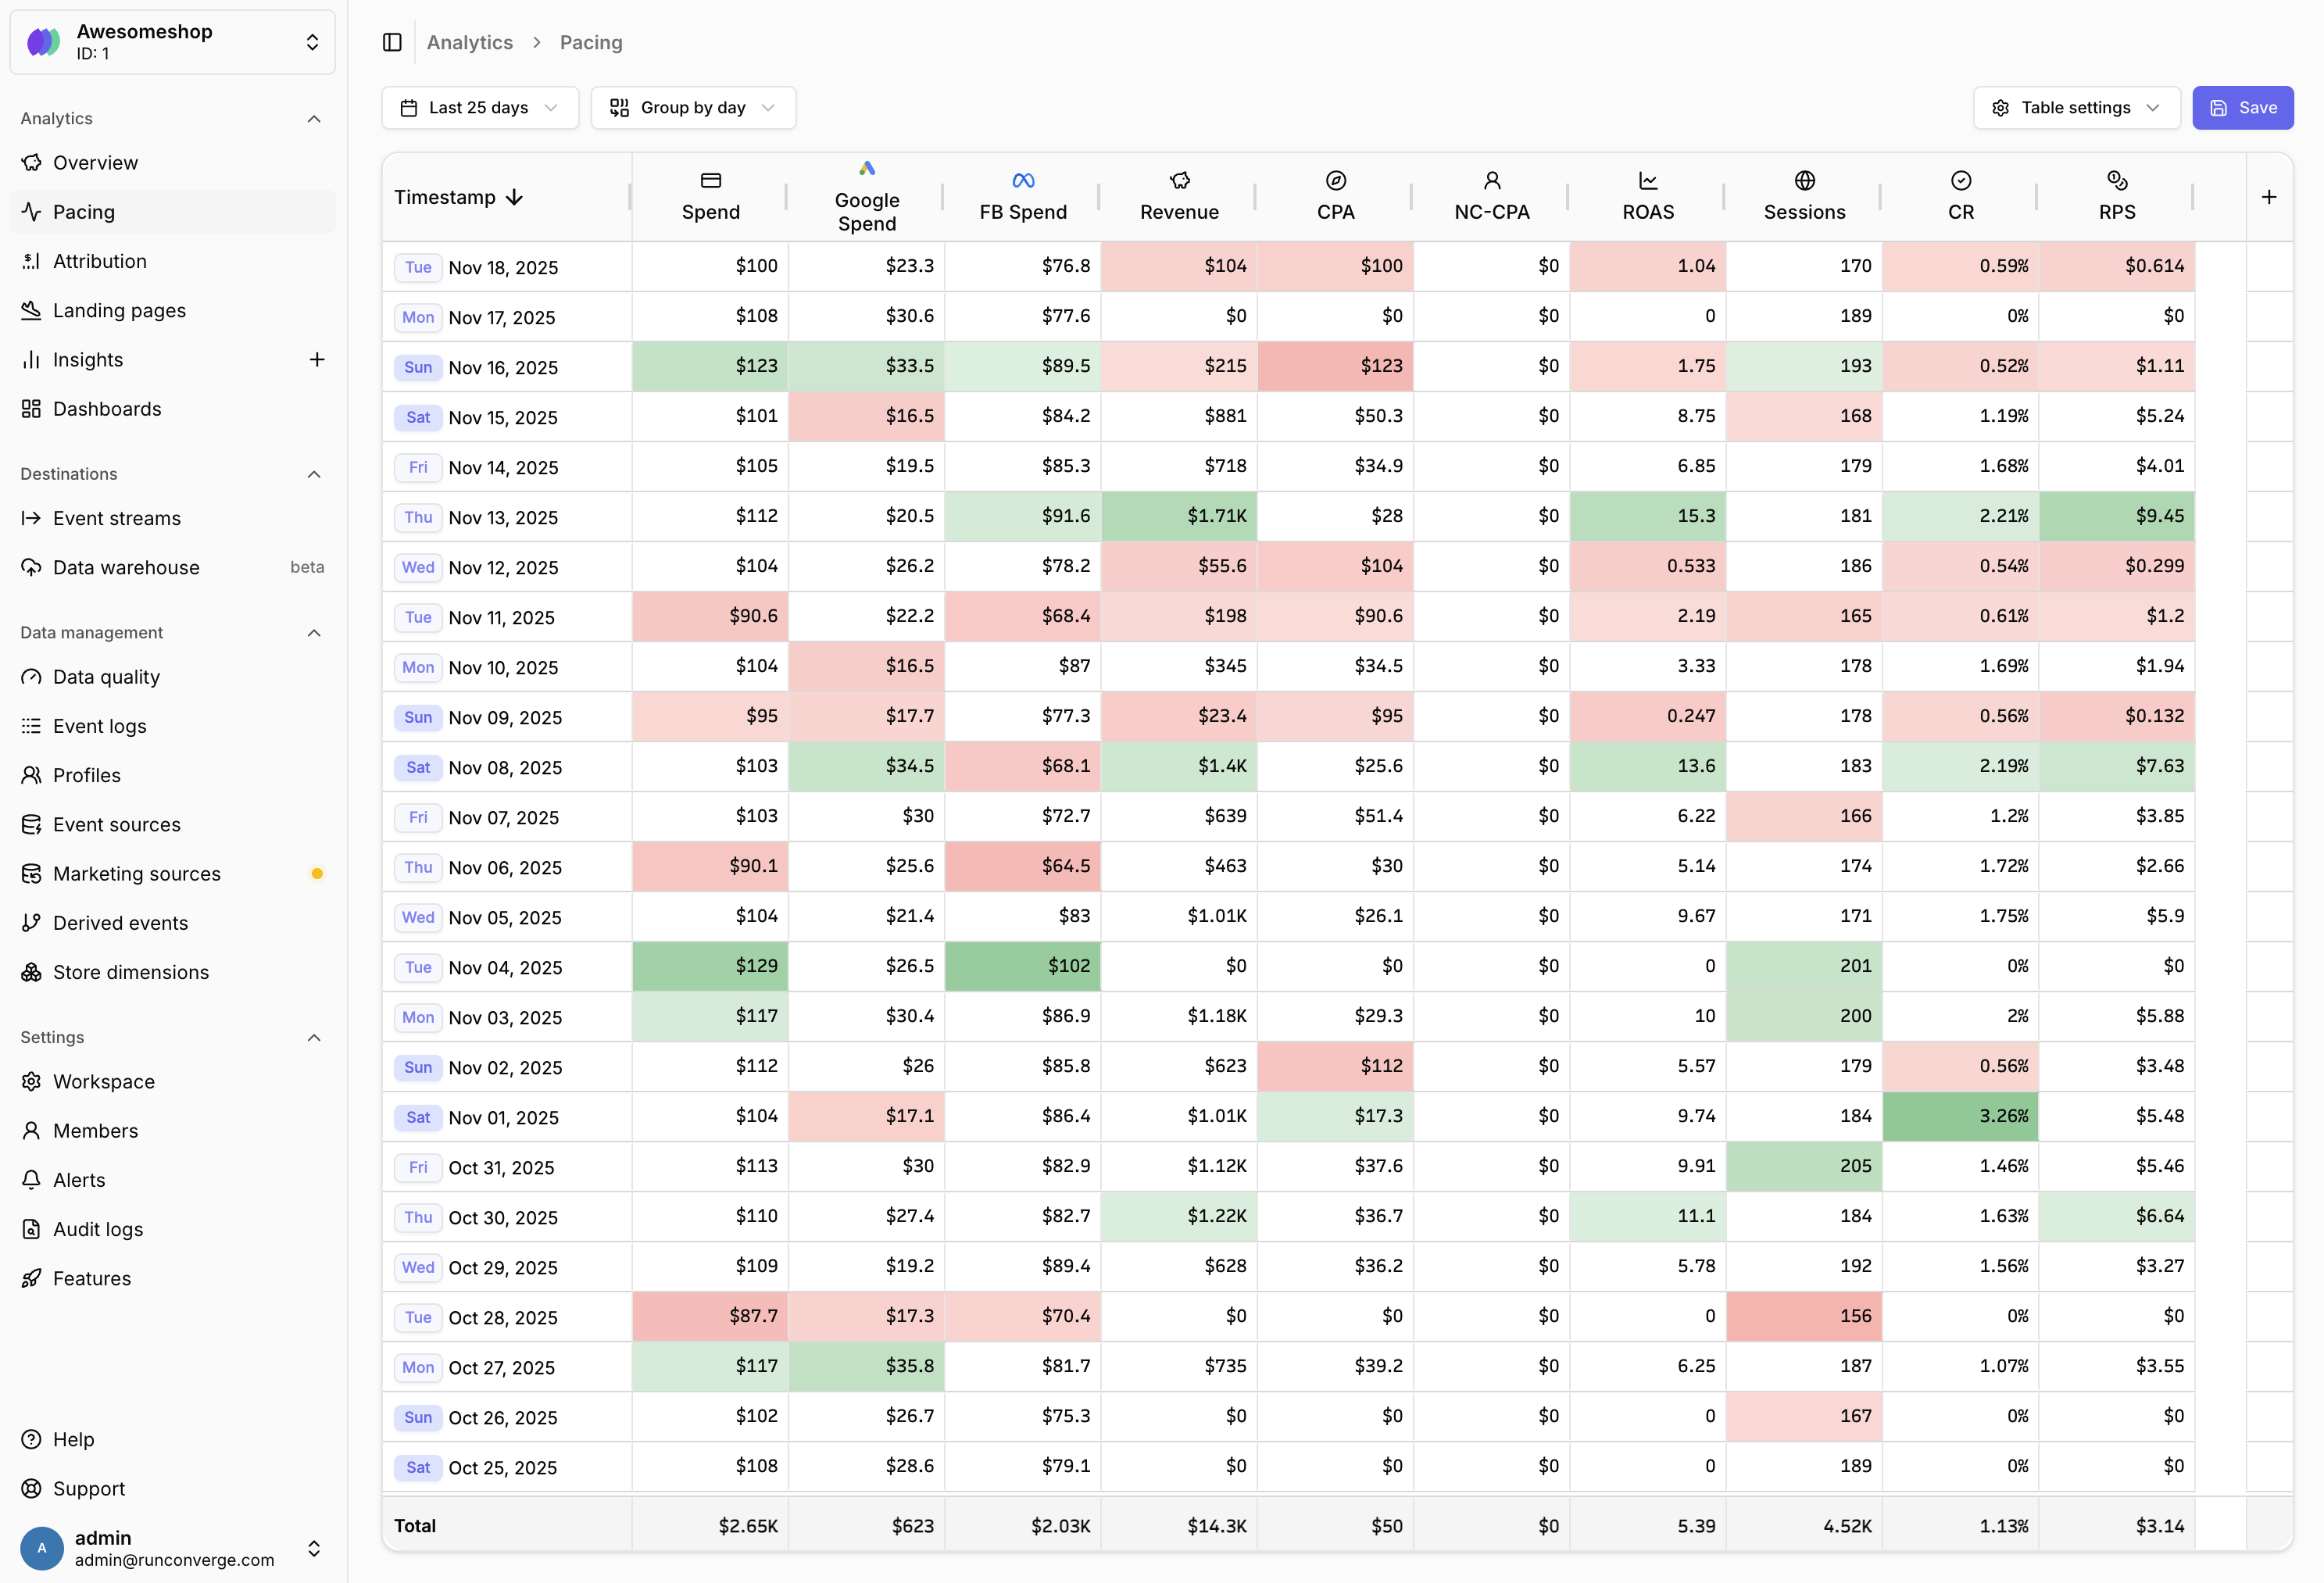
Pacing Sheet
Attribution report
The Attribution Report shows how your Channels, Campaigns, Ad sets, or Ads are performing—and what’s driving your business. Metrics are attributed using:- First-party attribution: Converge attribution based on the model you select and your tracking parameters. Identified with this icon: .
- In-platform attribution: Metrics from the ad platforms themselves. Identified with this icon: .
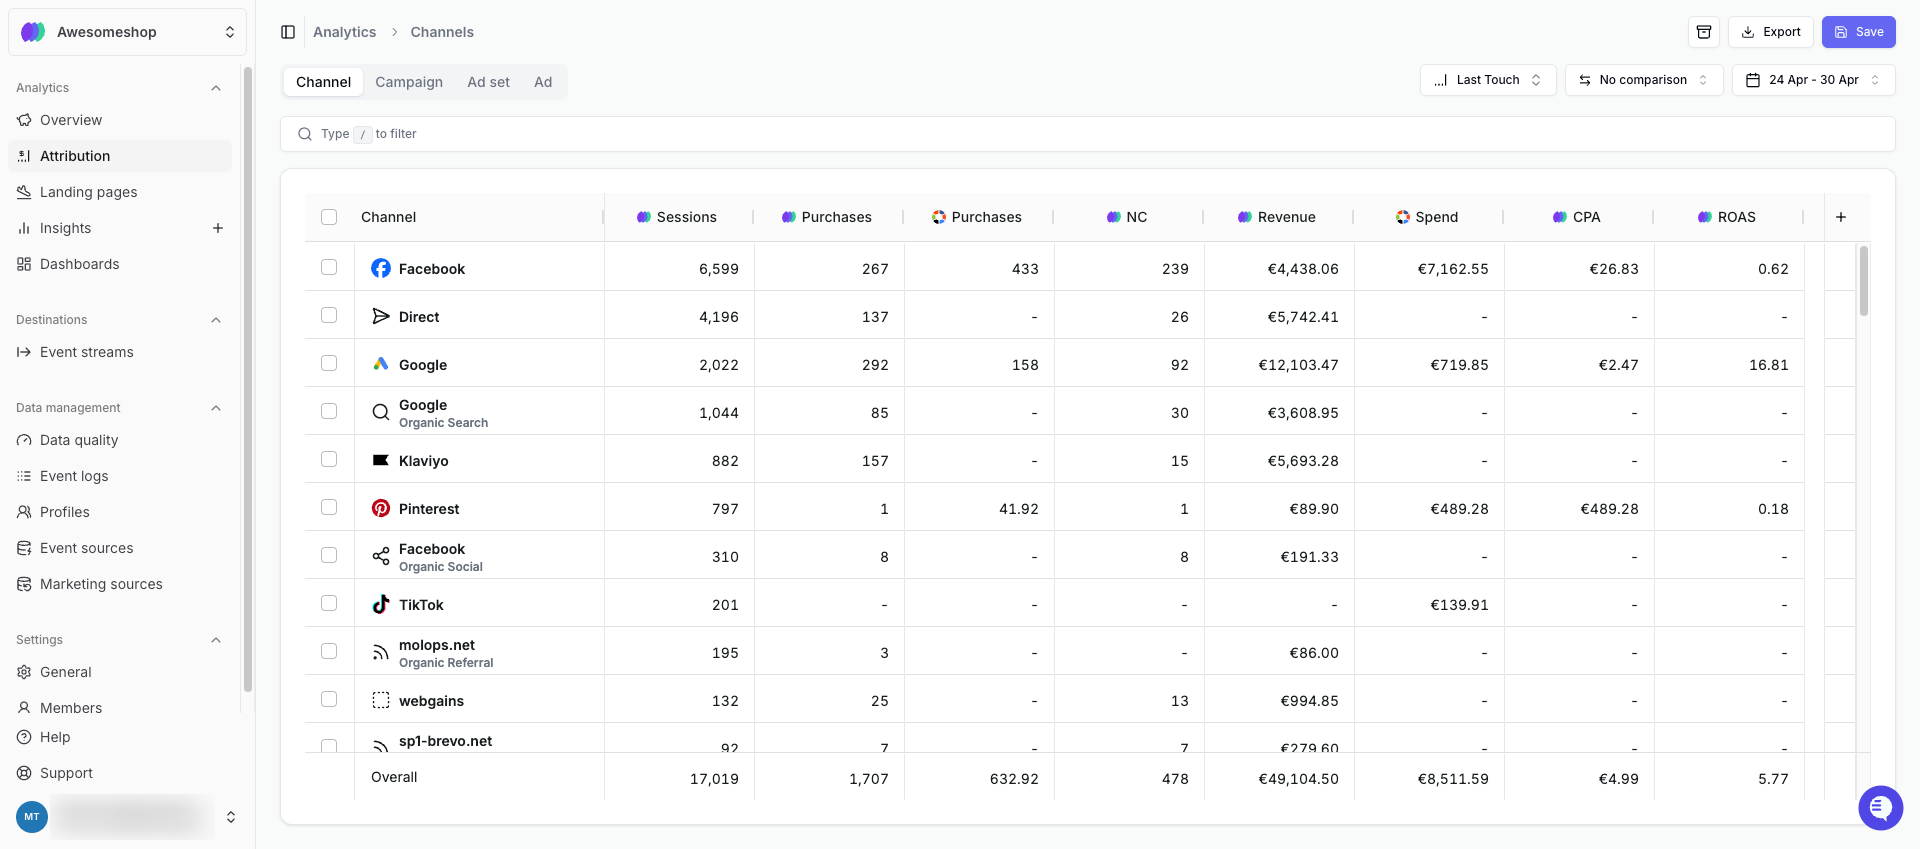
Attribution Report
Landing pages report
The Landing Pages Report shows performance for each page users landed on. Metrics include sessions, purchases, revenue, and conversion rate. You can customize this report to focus on metrics that matter to you.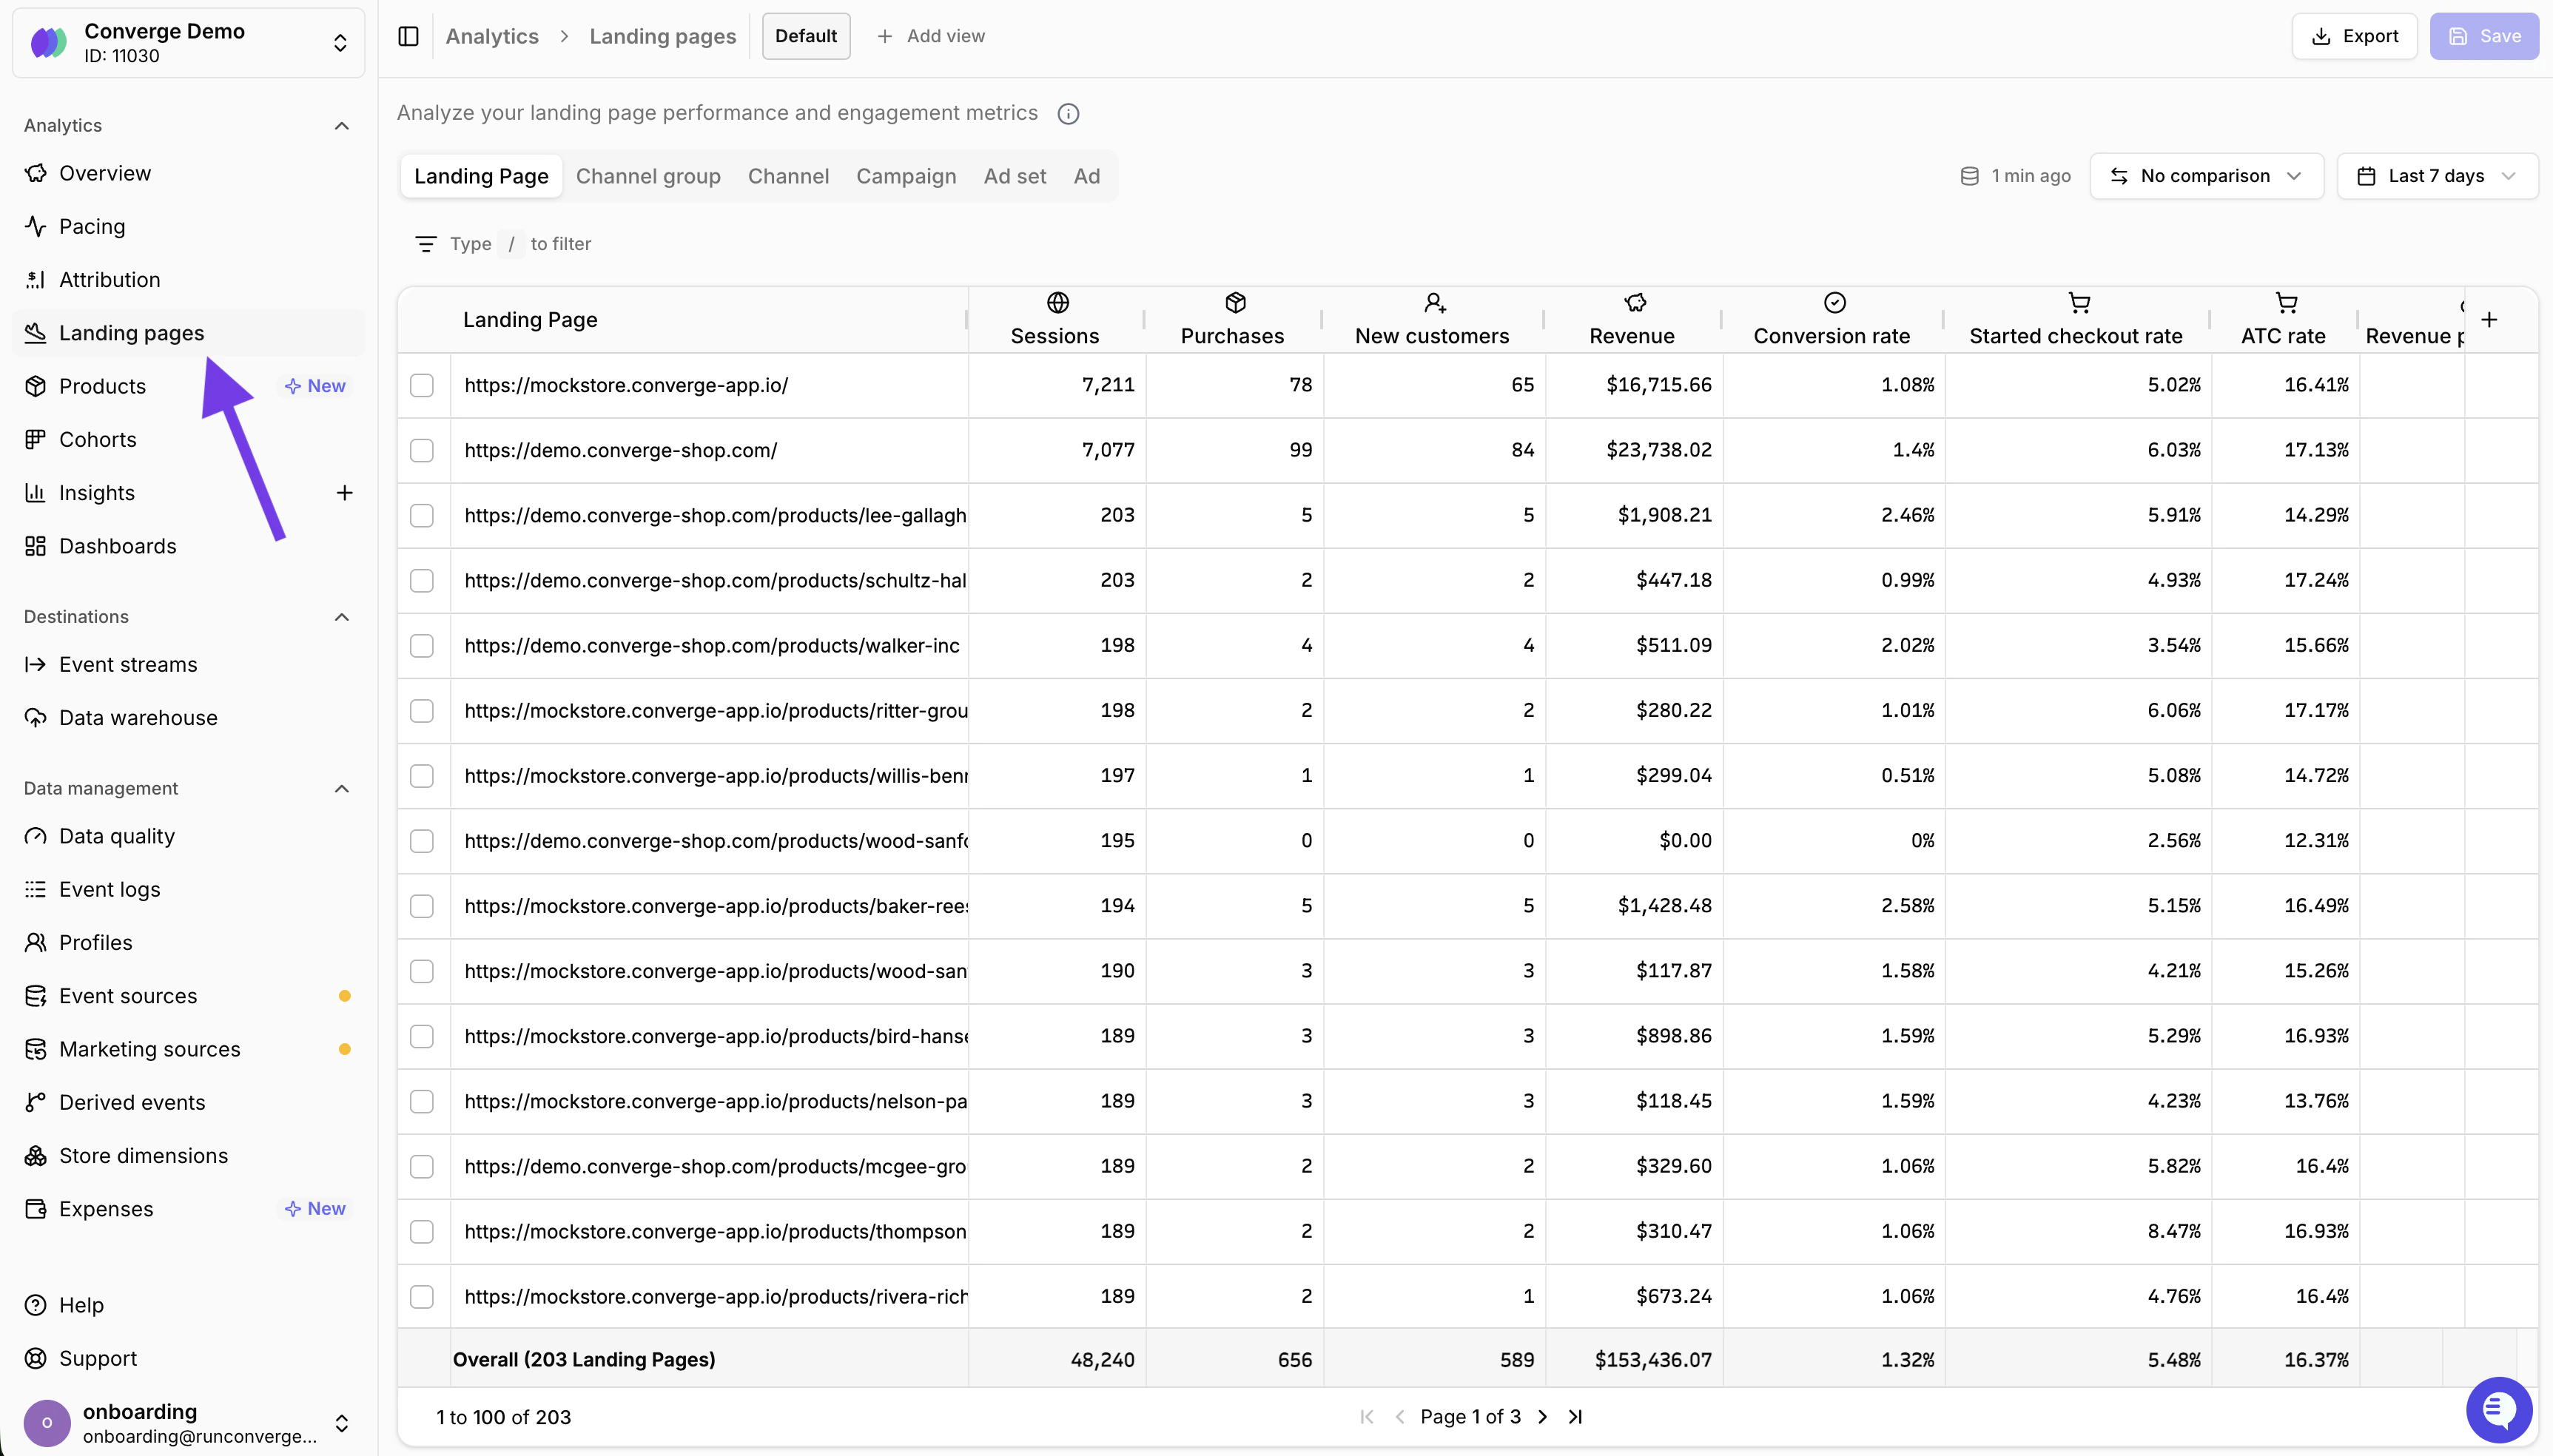
Landing Pages Report
Product report
The Product Report shows how individual products are performing across your store. Use it to make smarter ad buying decisions on a per-product level and scale budgets toward your best performers. It includes metrics like:- Items sold: Number of units sold per product.
- Revenue: Total revenue generated per product.
- Spend: Estimated ad spend per product.
- Average price: Average selling price per product.
- CPA: Cost per acquisition for each product.
- Conversion rate: How often views of a product lead to a purchase.
Spend is calculated by taking your total ad spend and dividing it across products proportionally based on the number of “Viewed Product” events that originated from paid sessions.
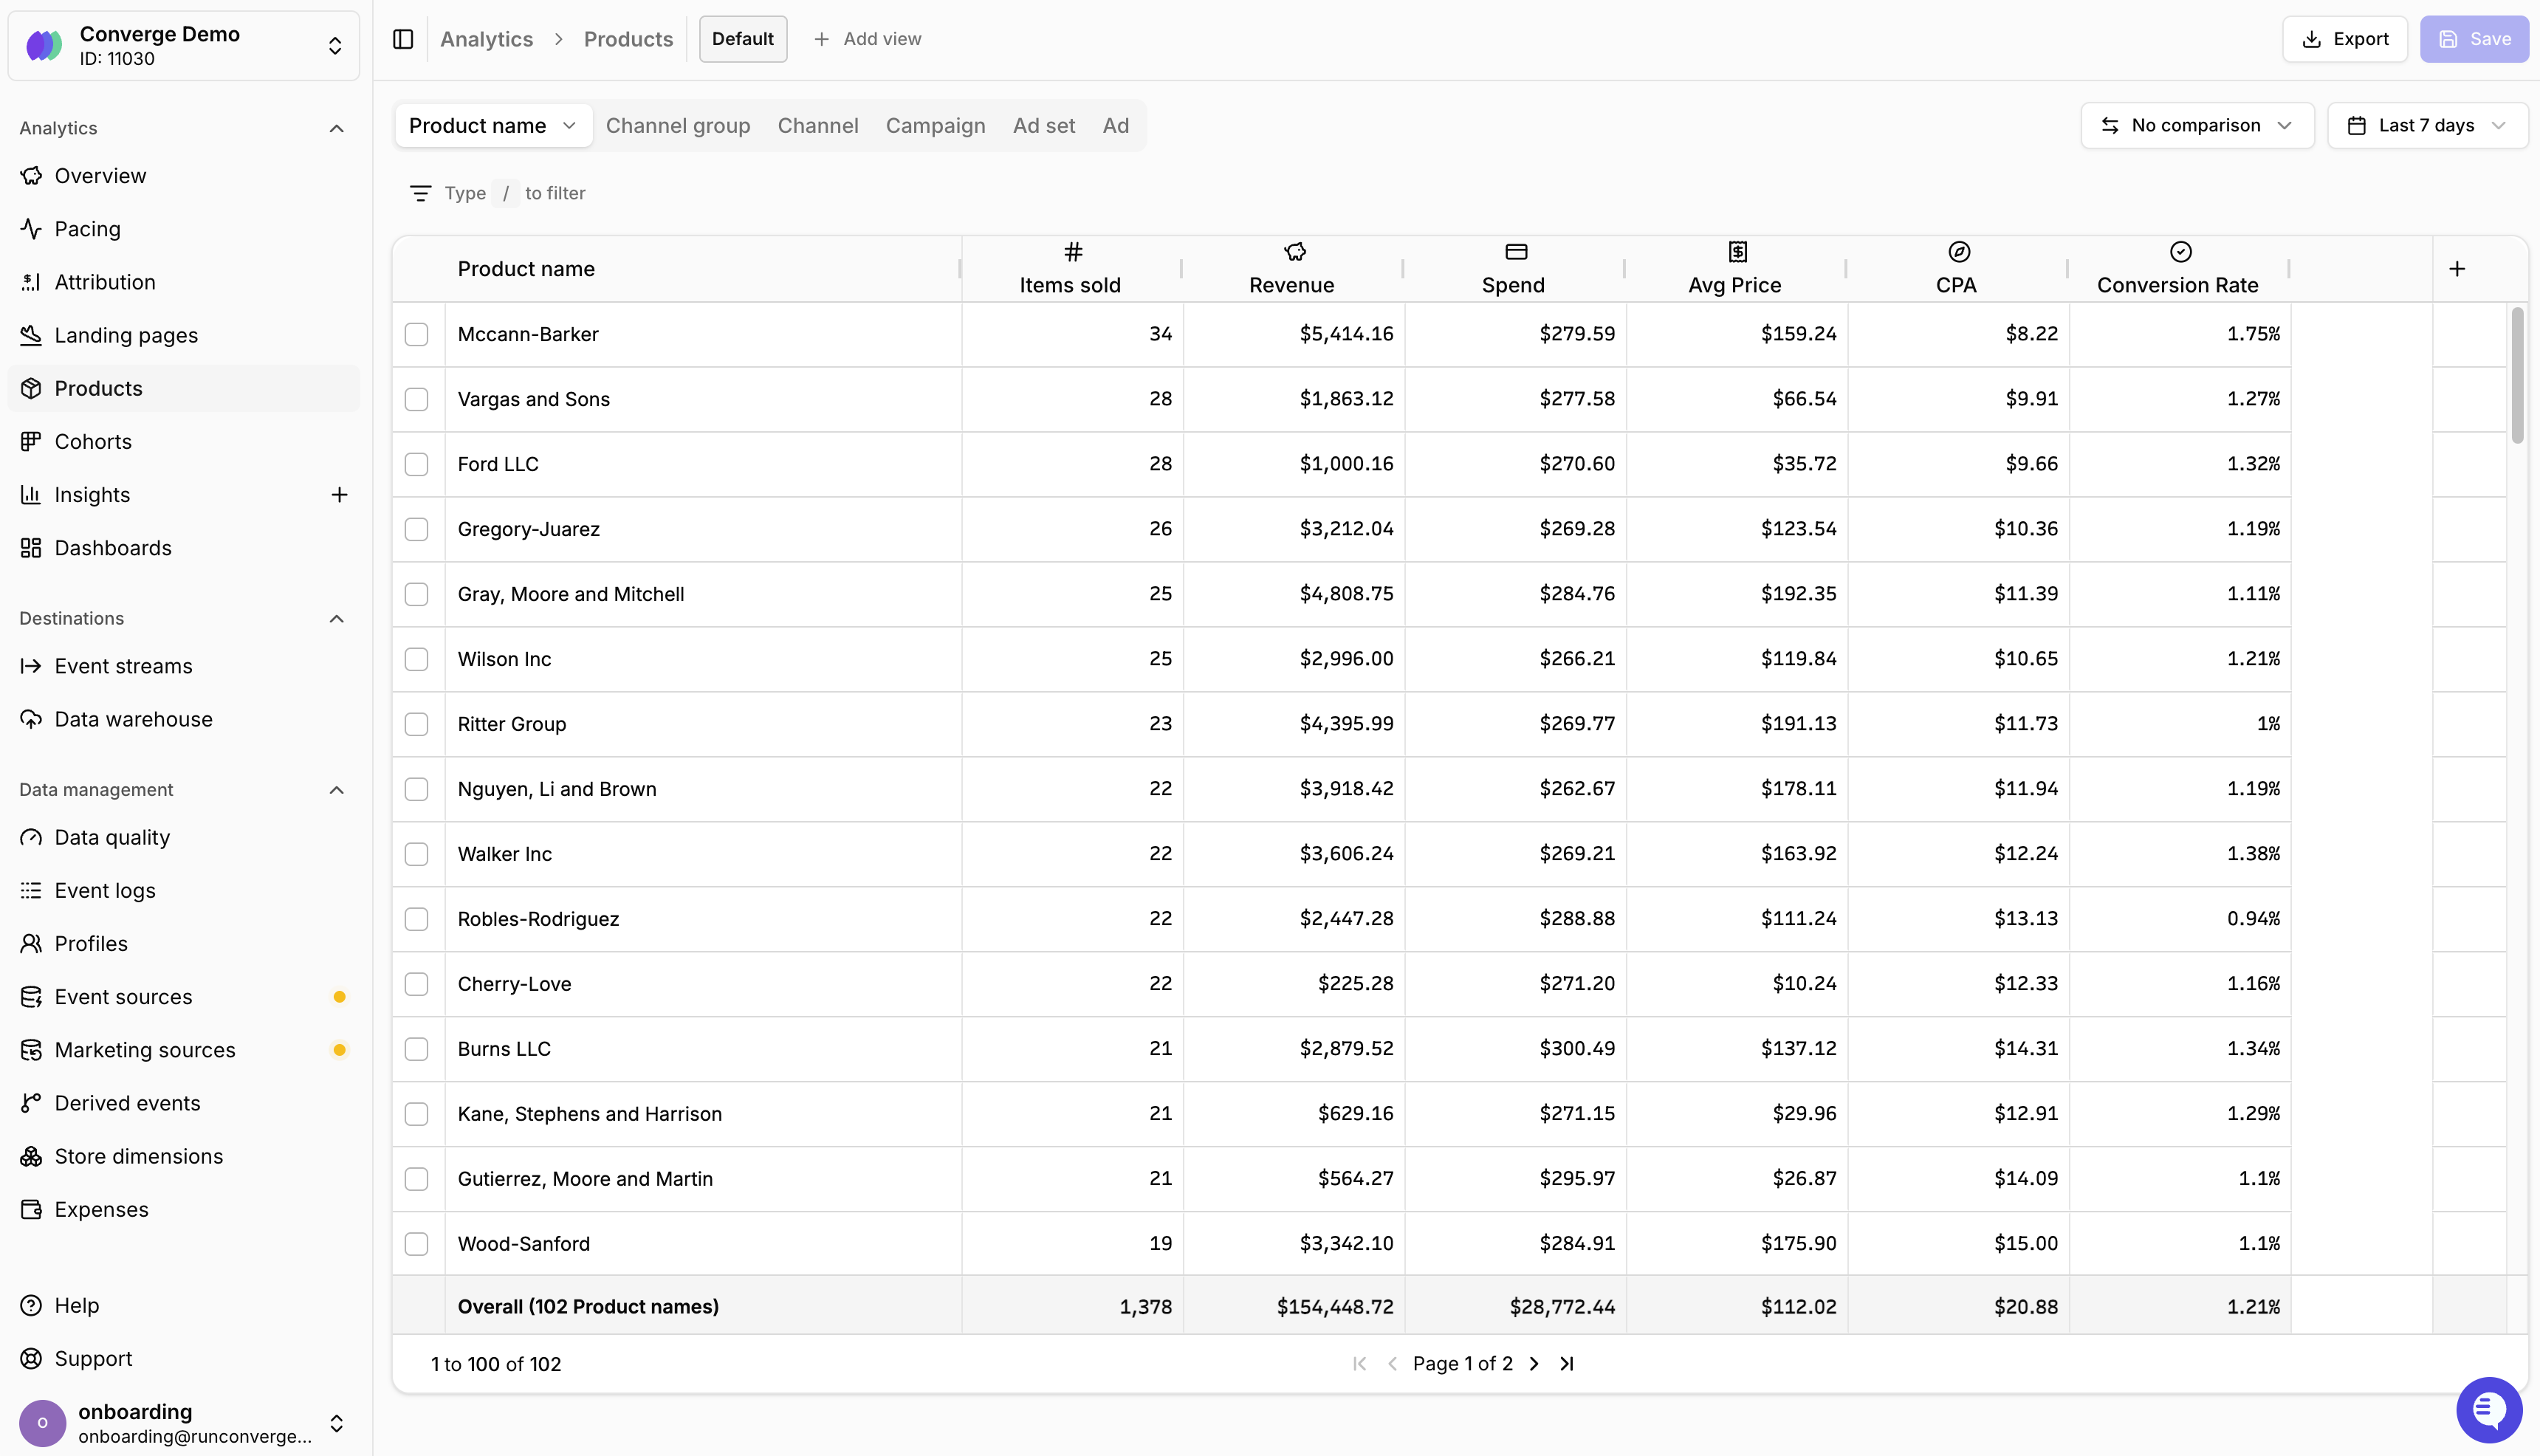
Product Page
Insights
Insights are custom reports you can create to further analyze your data. Reports can use data from your Event sources and Marketing sources, and can show predefined metrics or calculate custom metrics. You can visualize Insights as: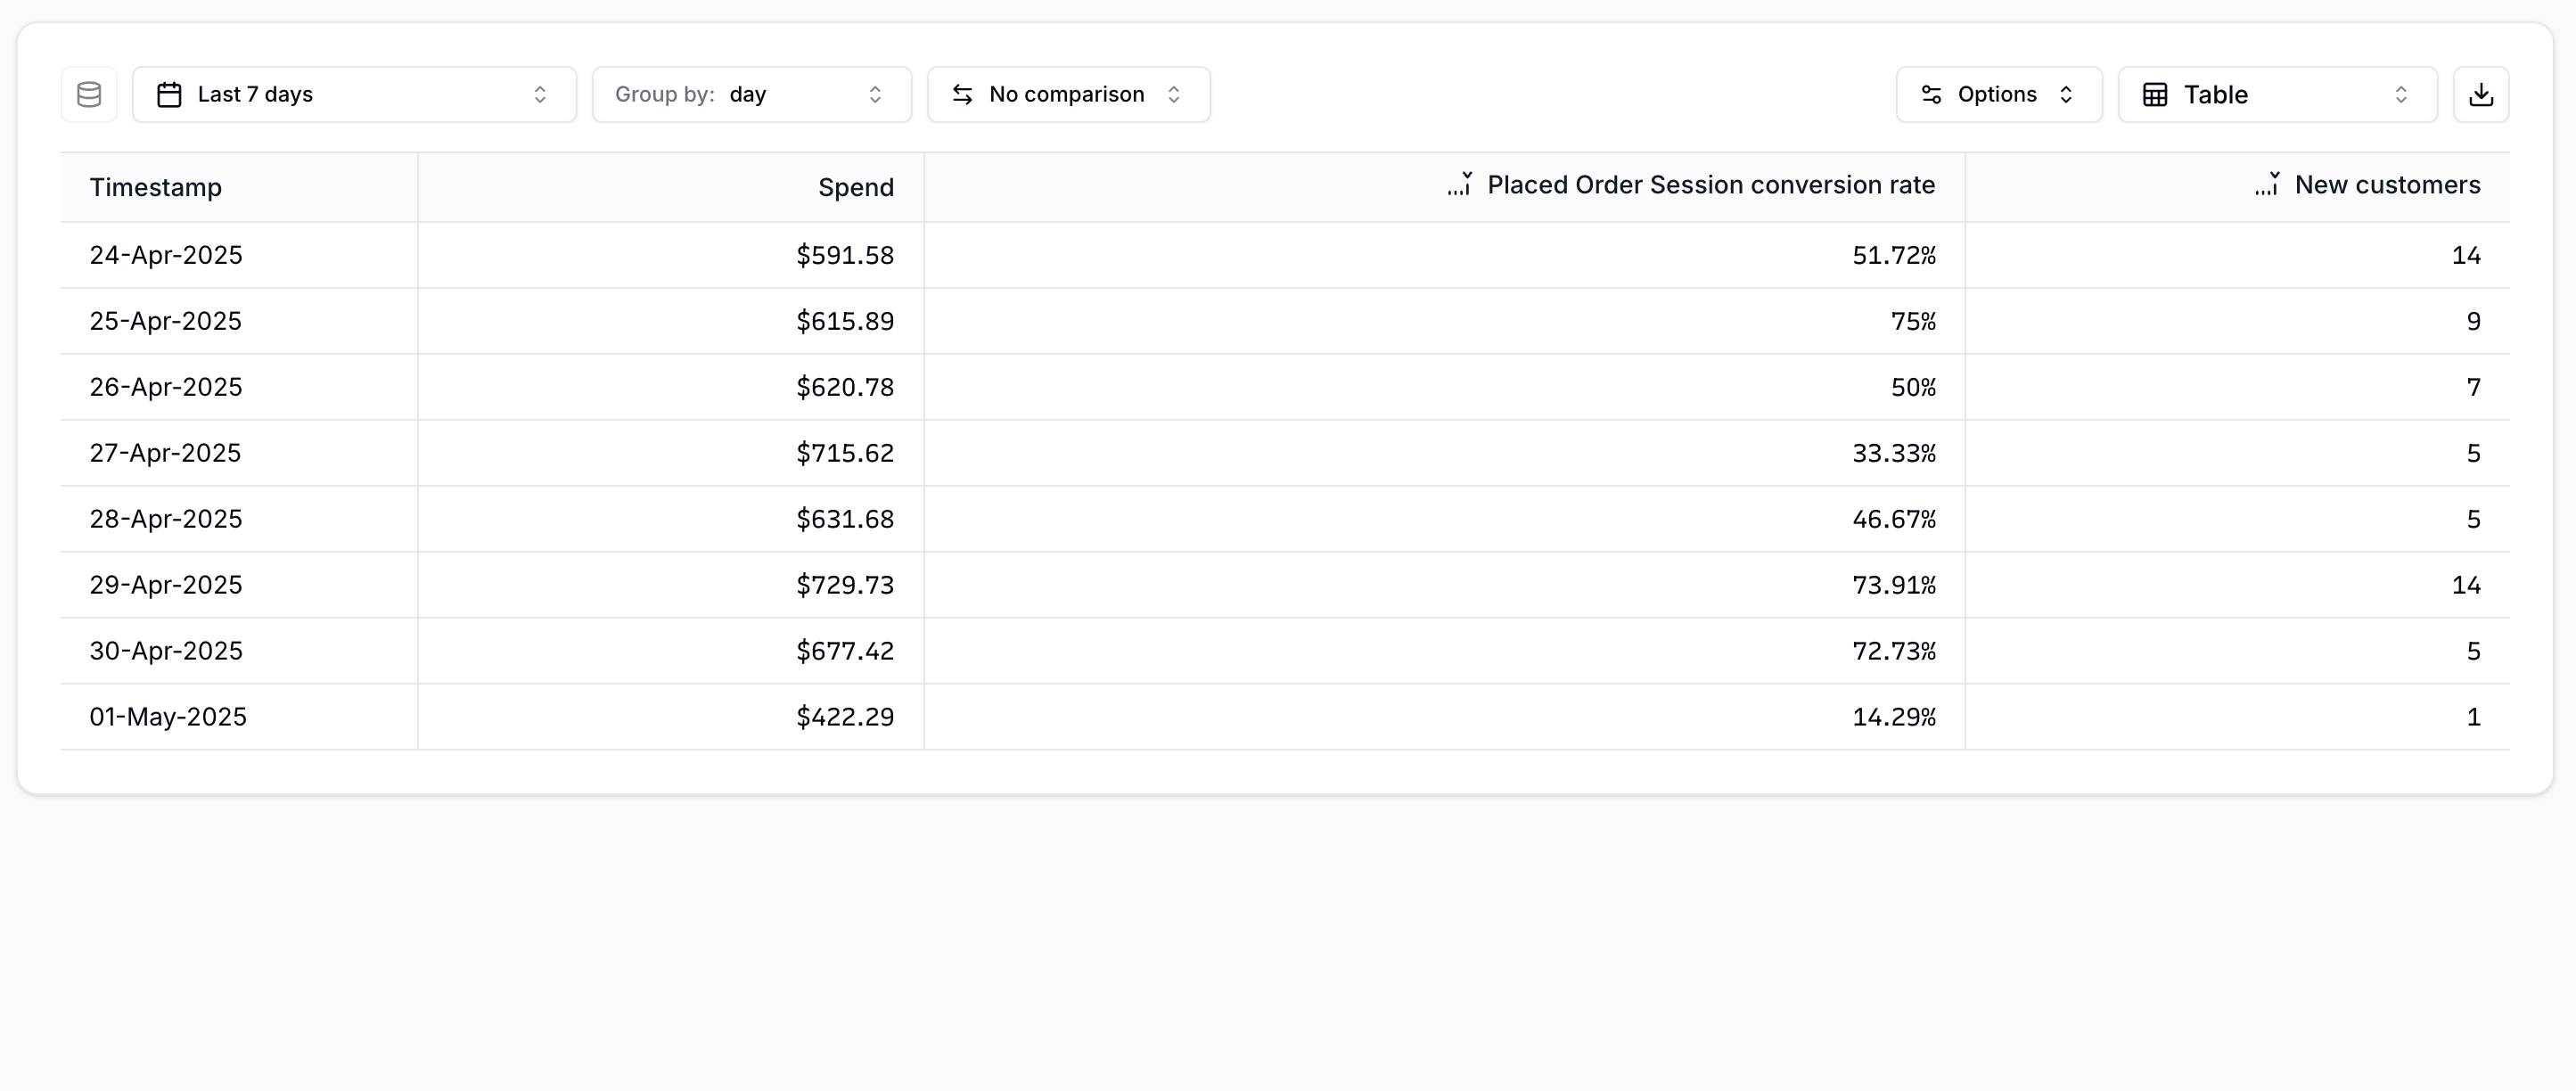 Table | 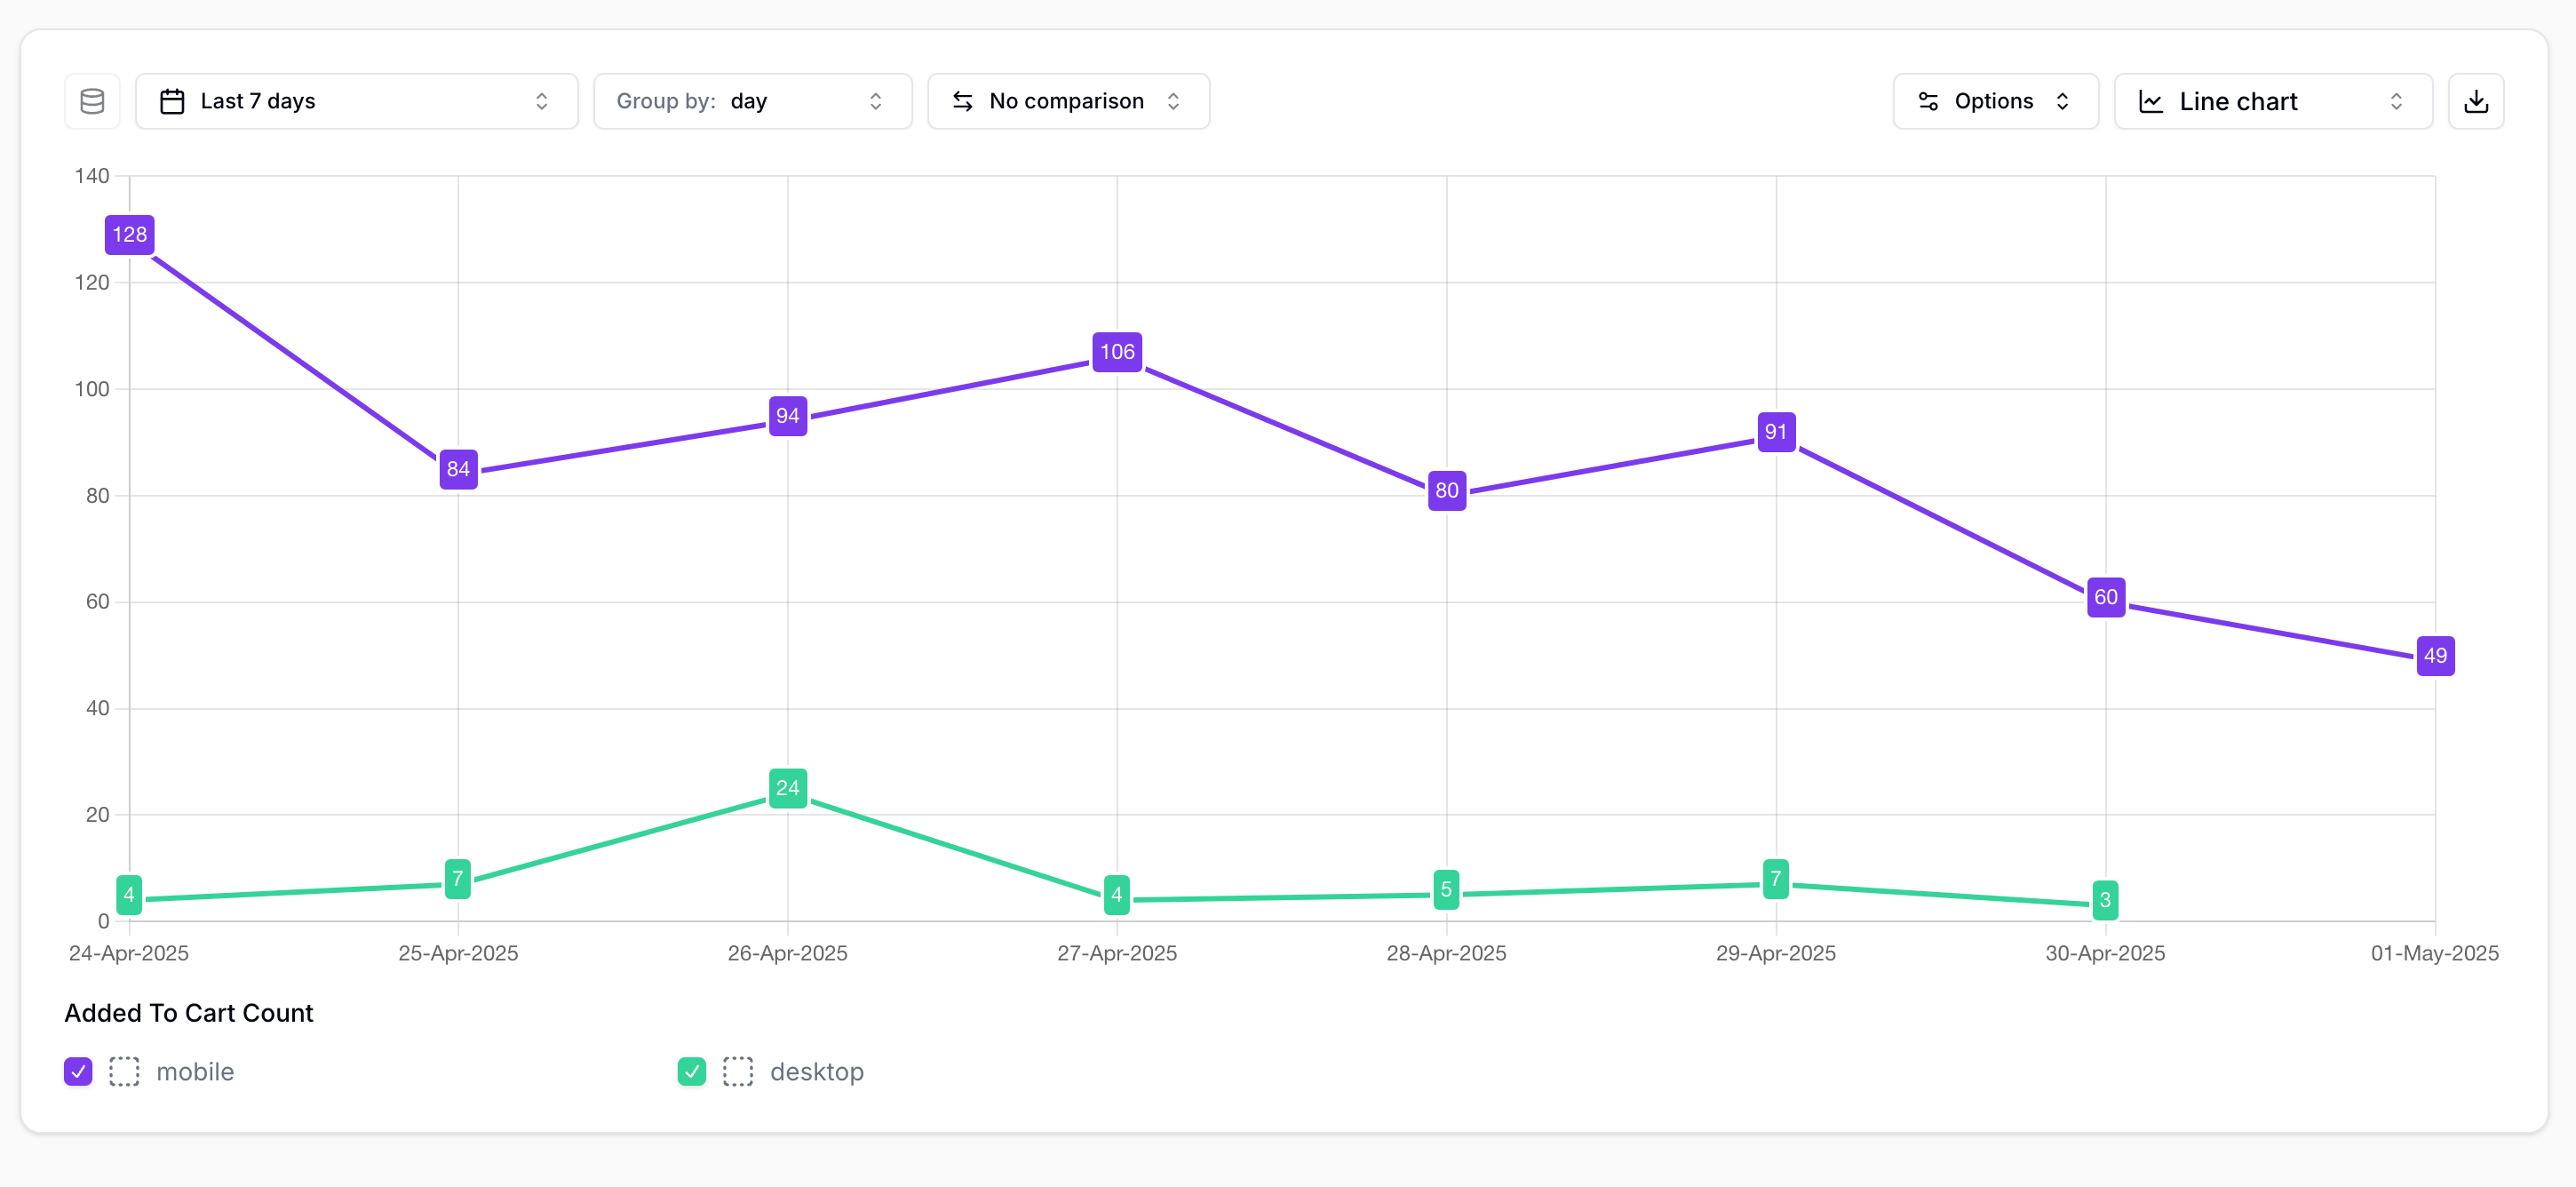 Line chart | |
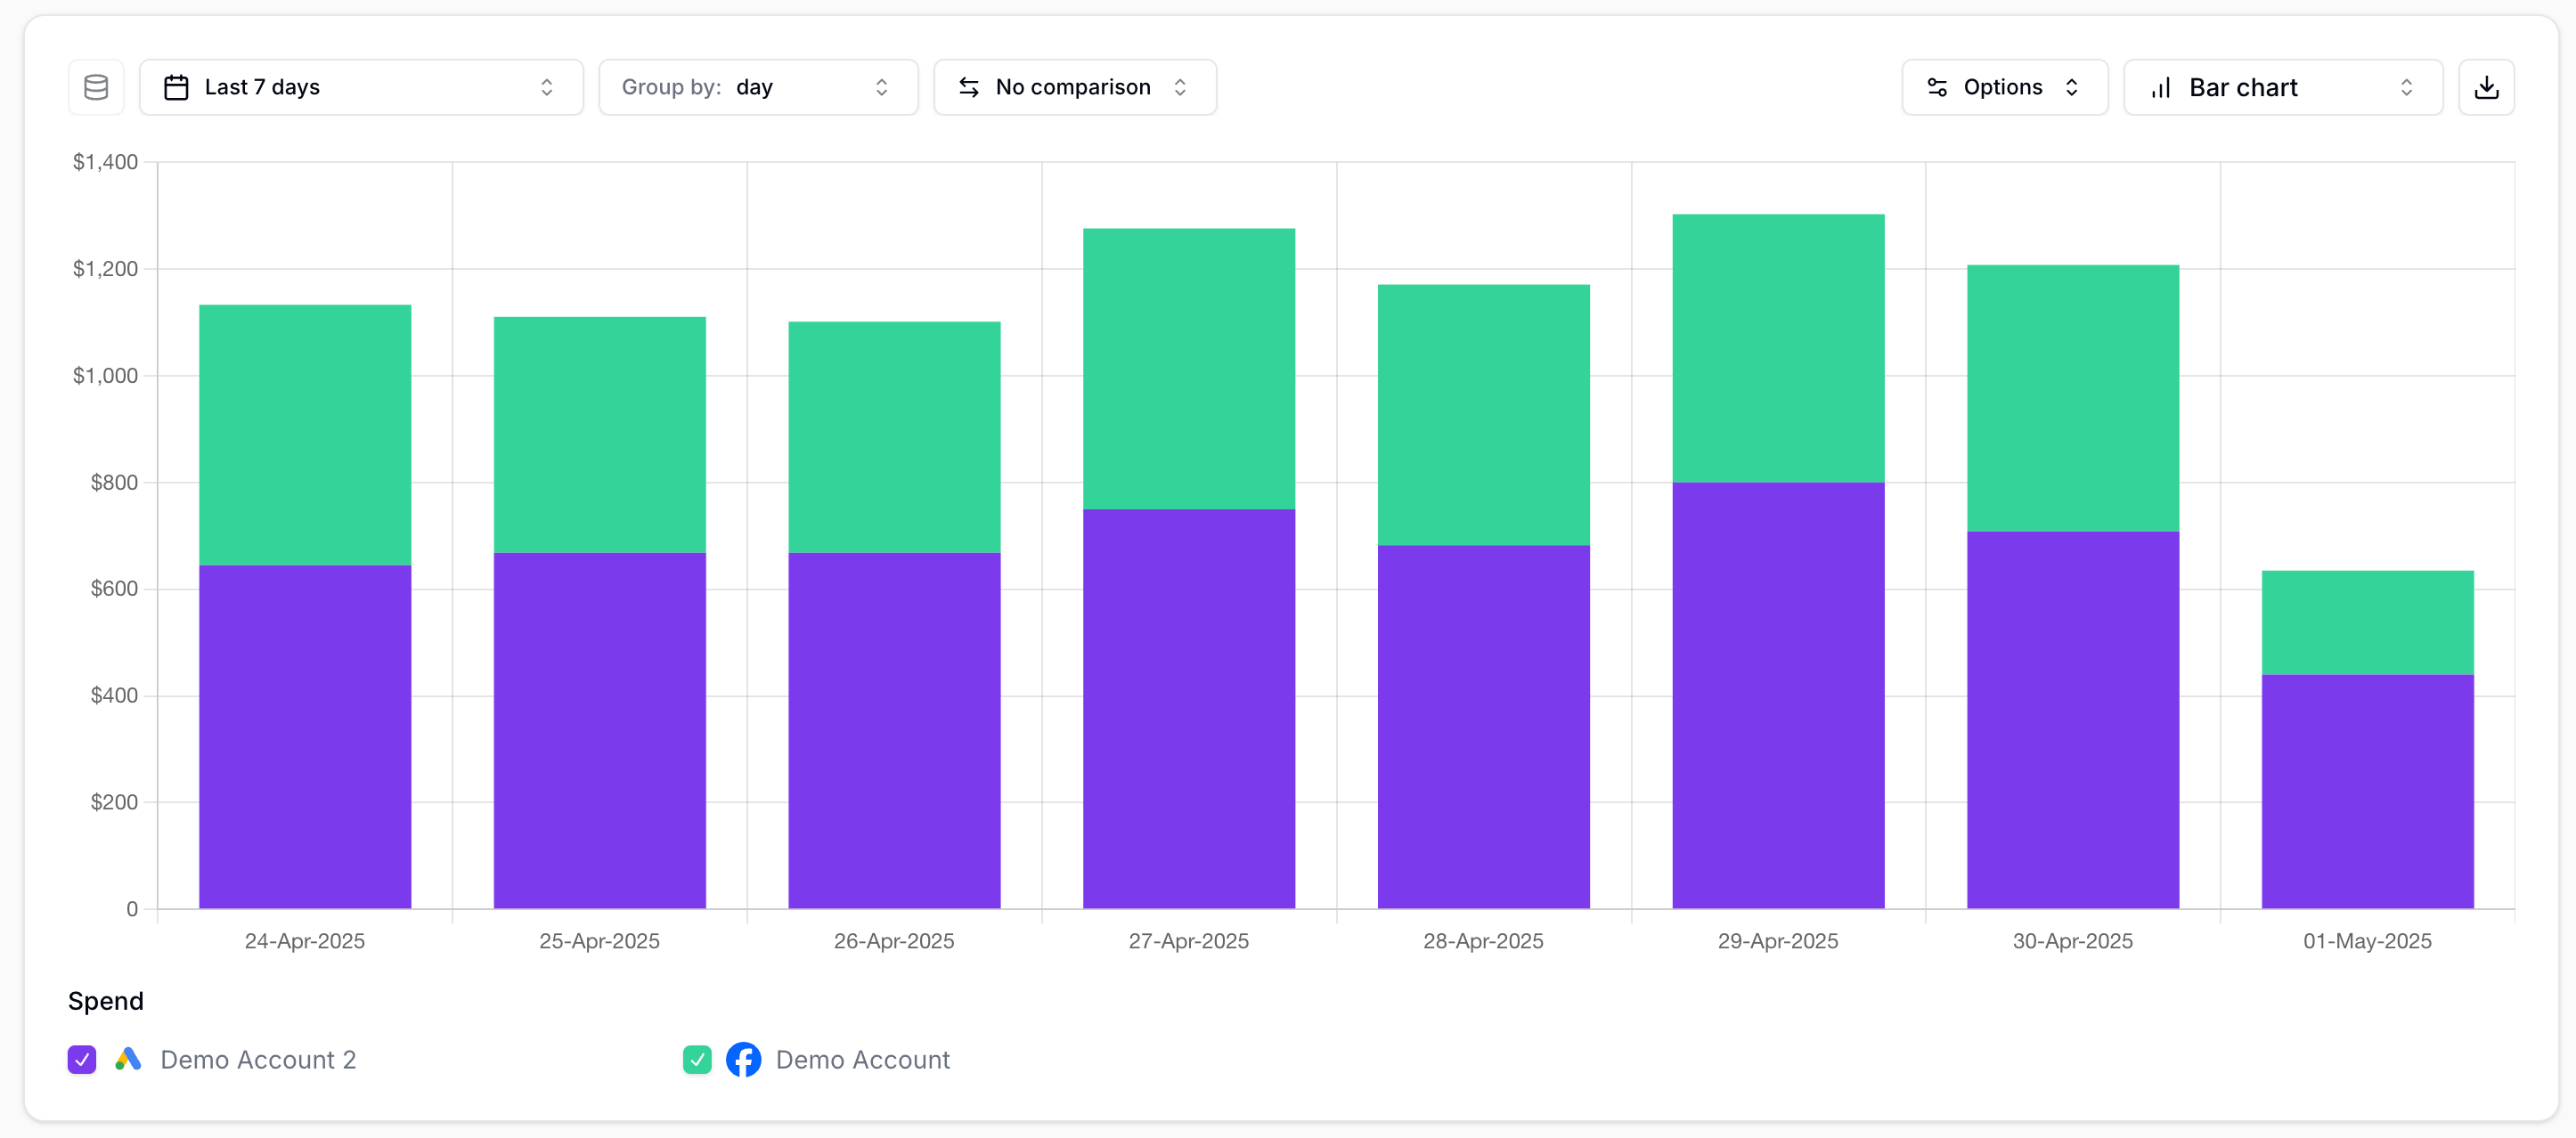 Bar chart (vertical) | 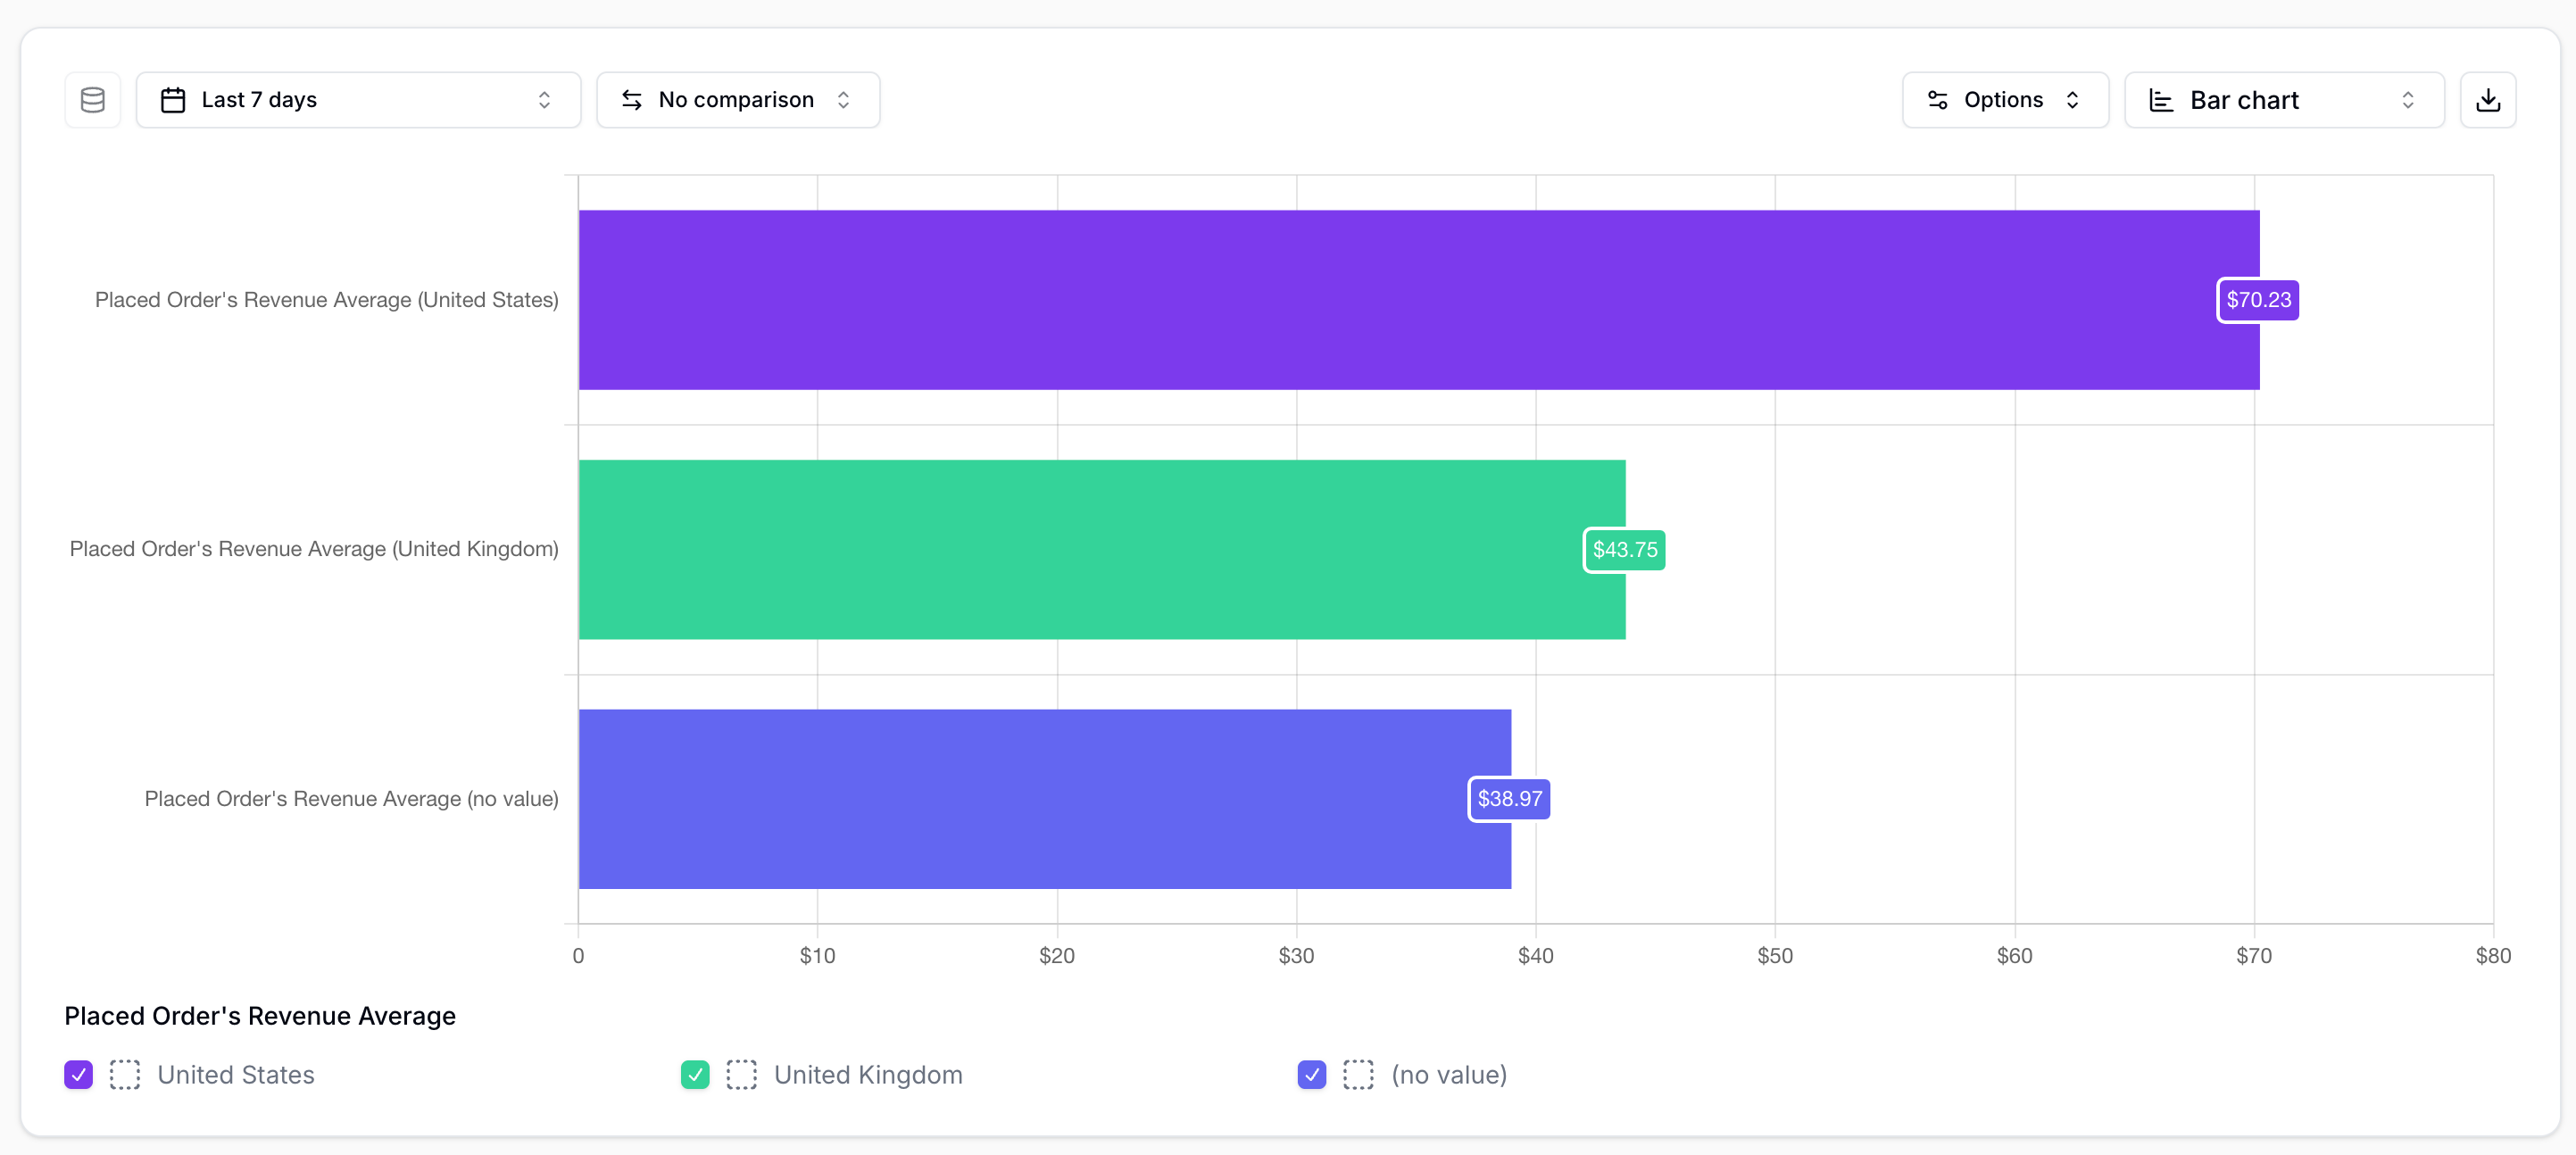 Bar chart (horizontal) | |
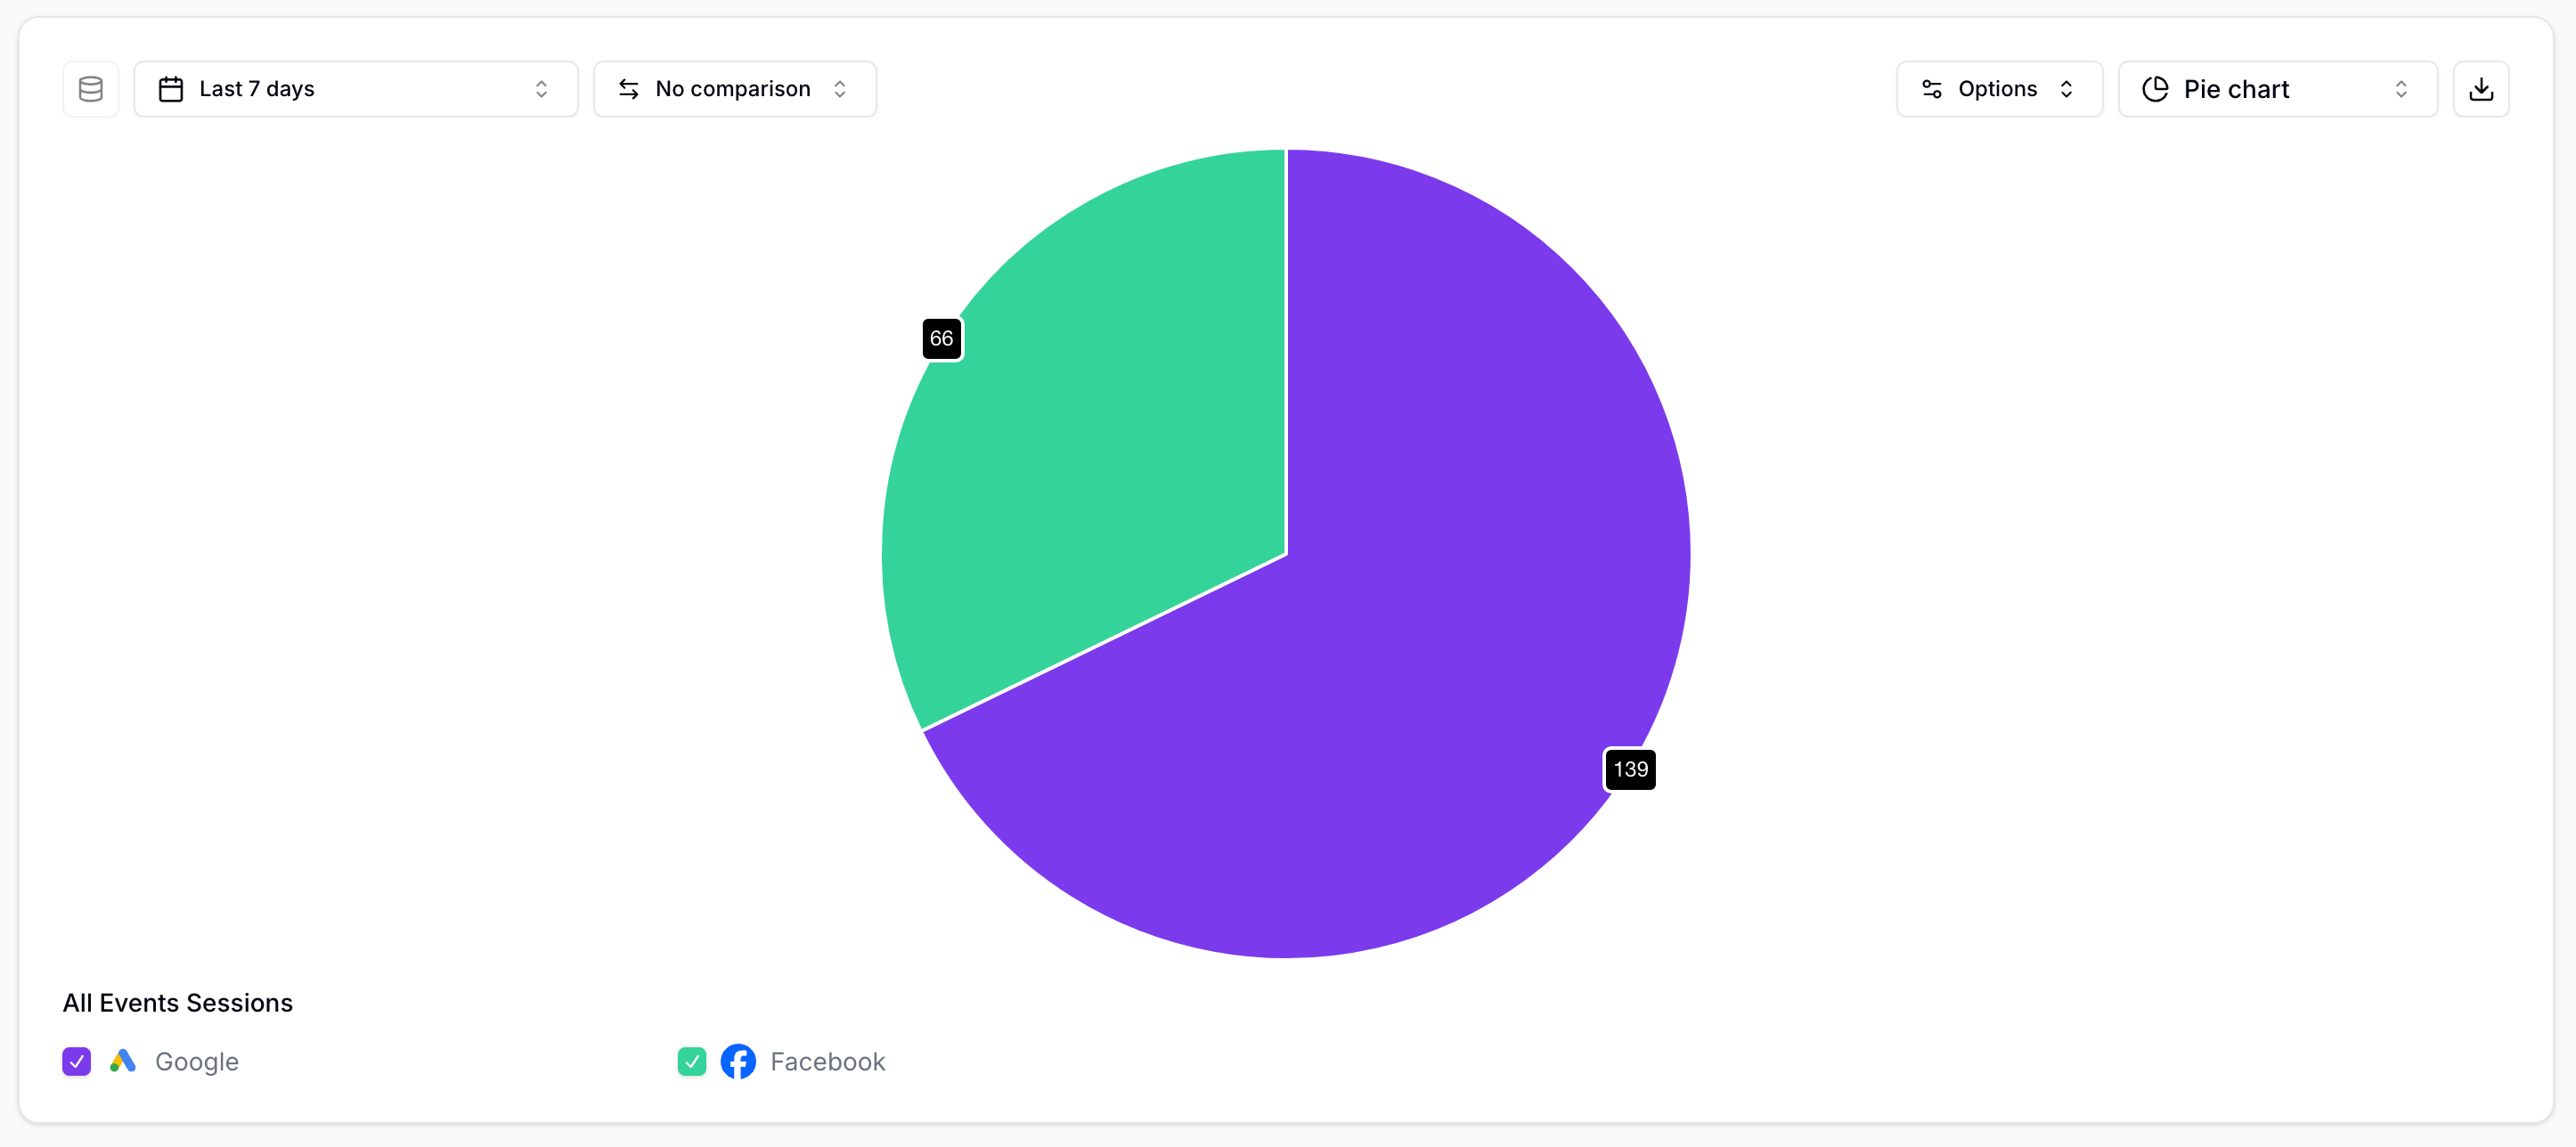 Pie chart | 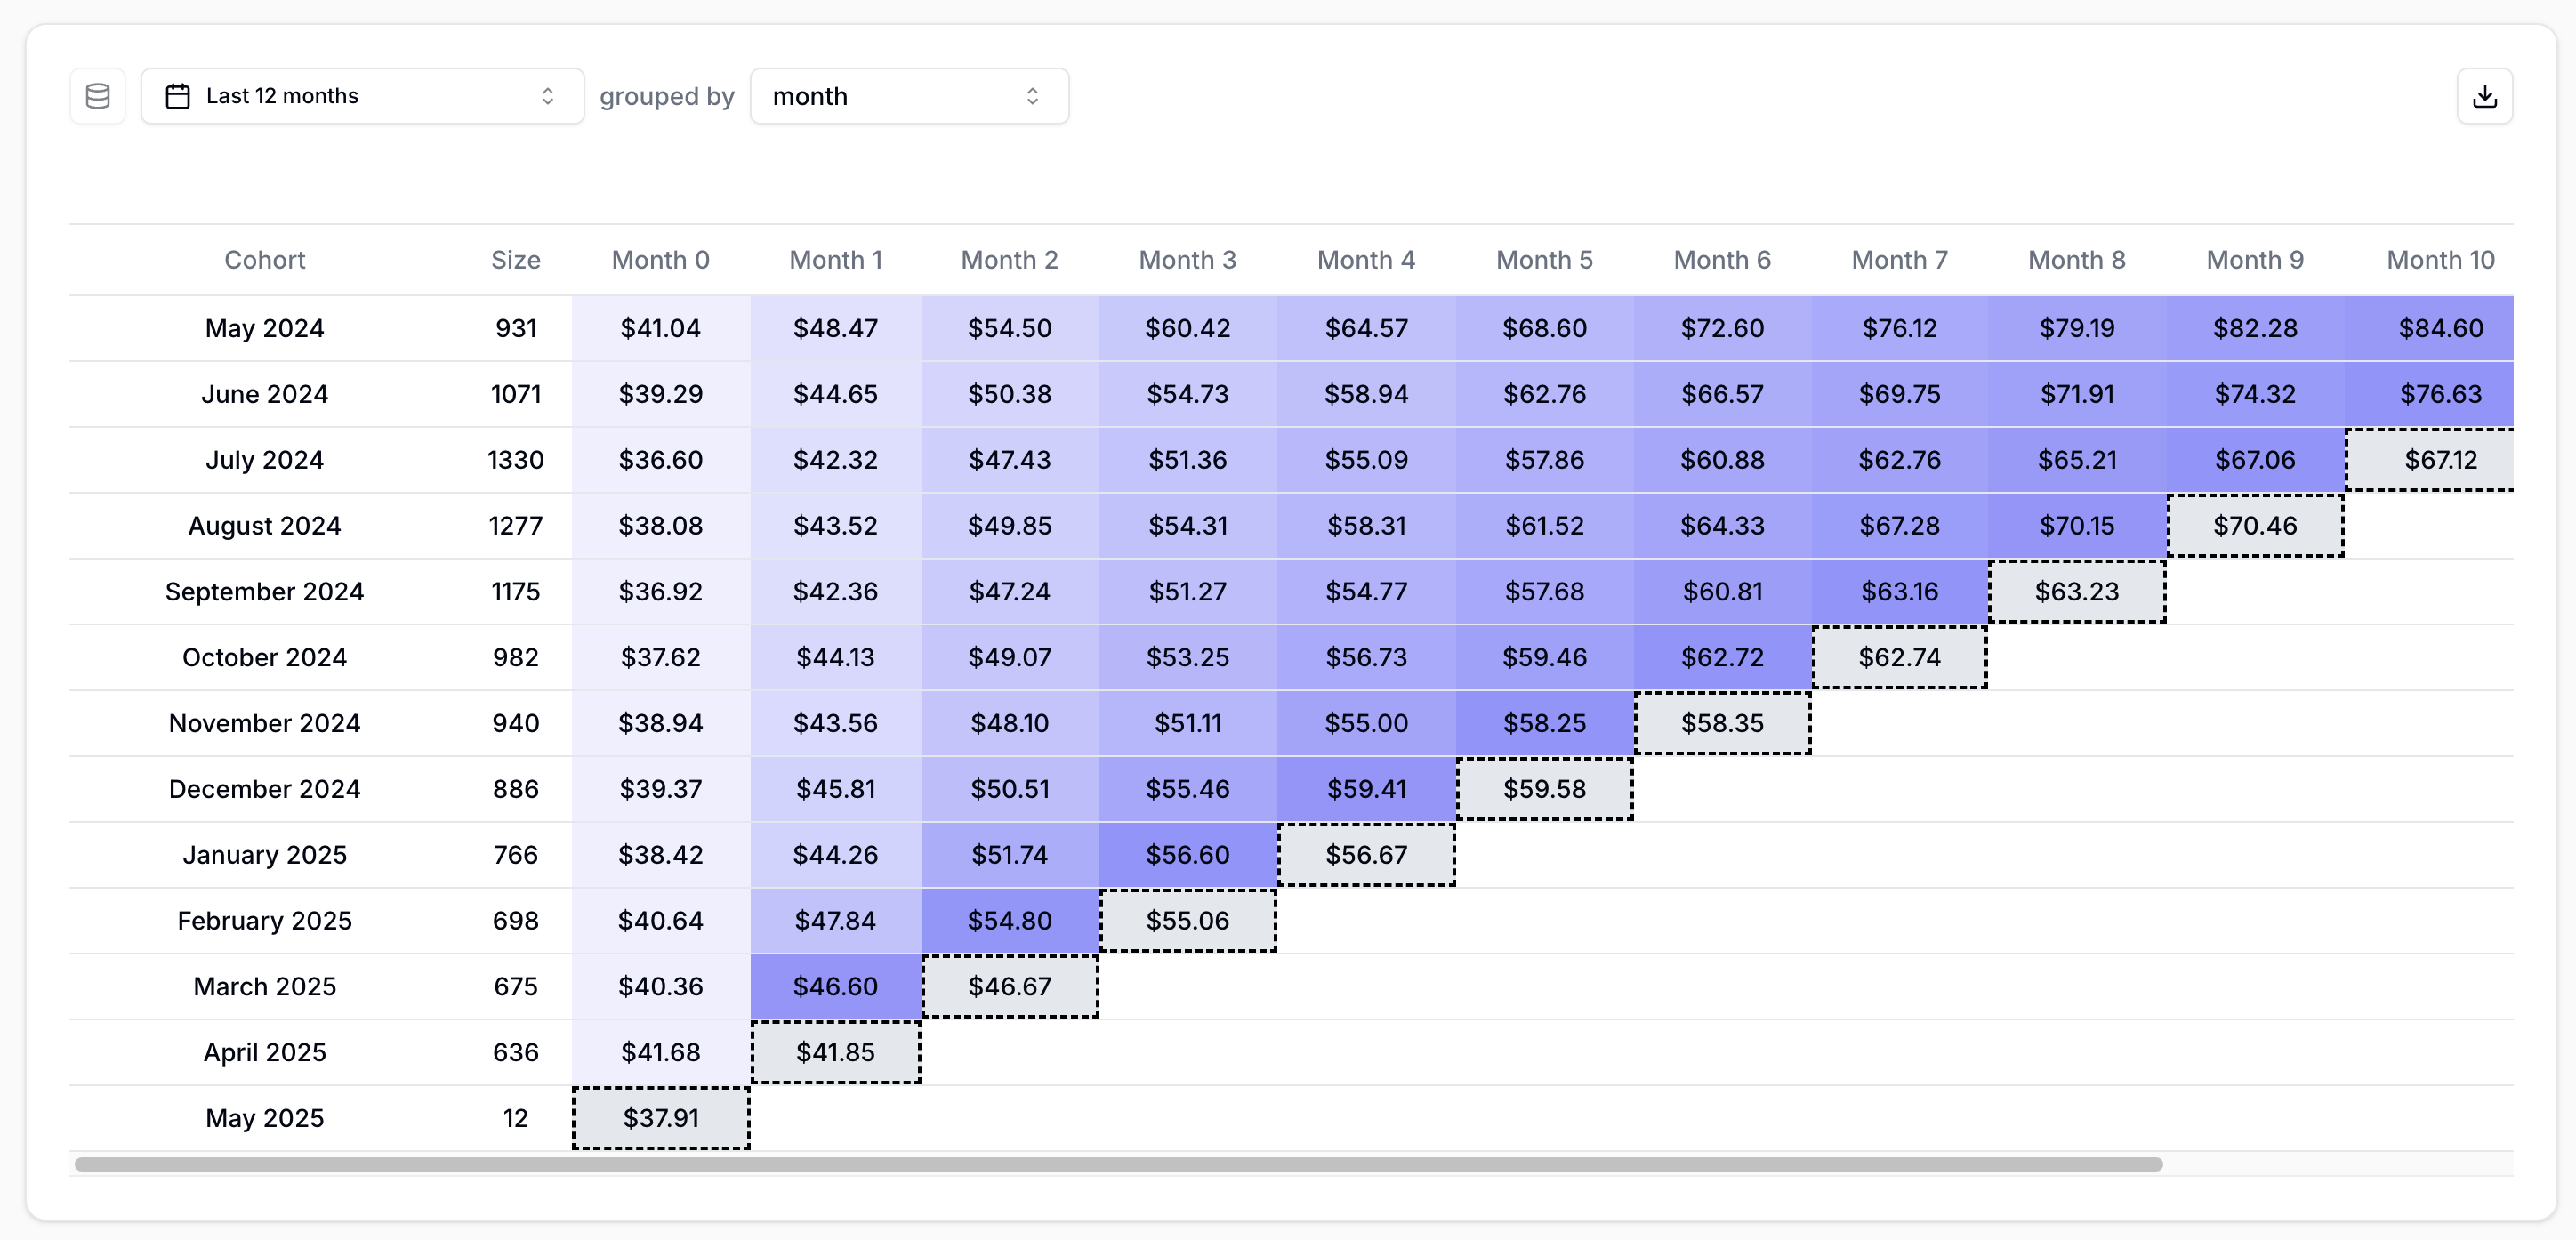 Cohort | |
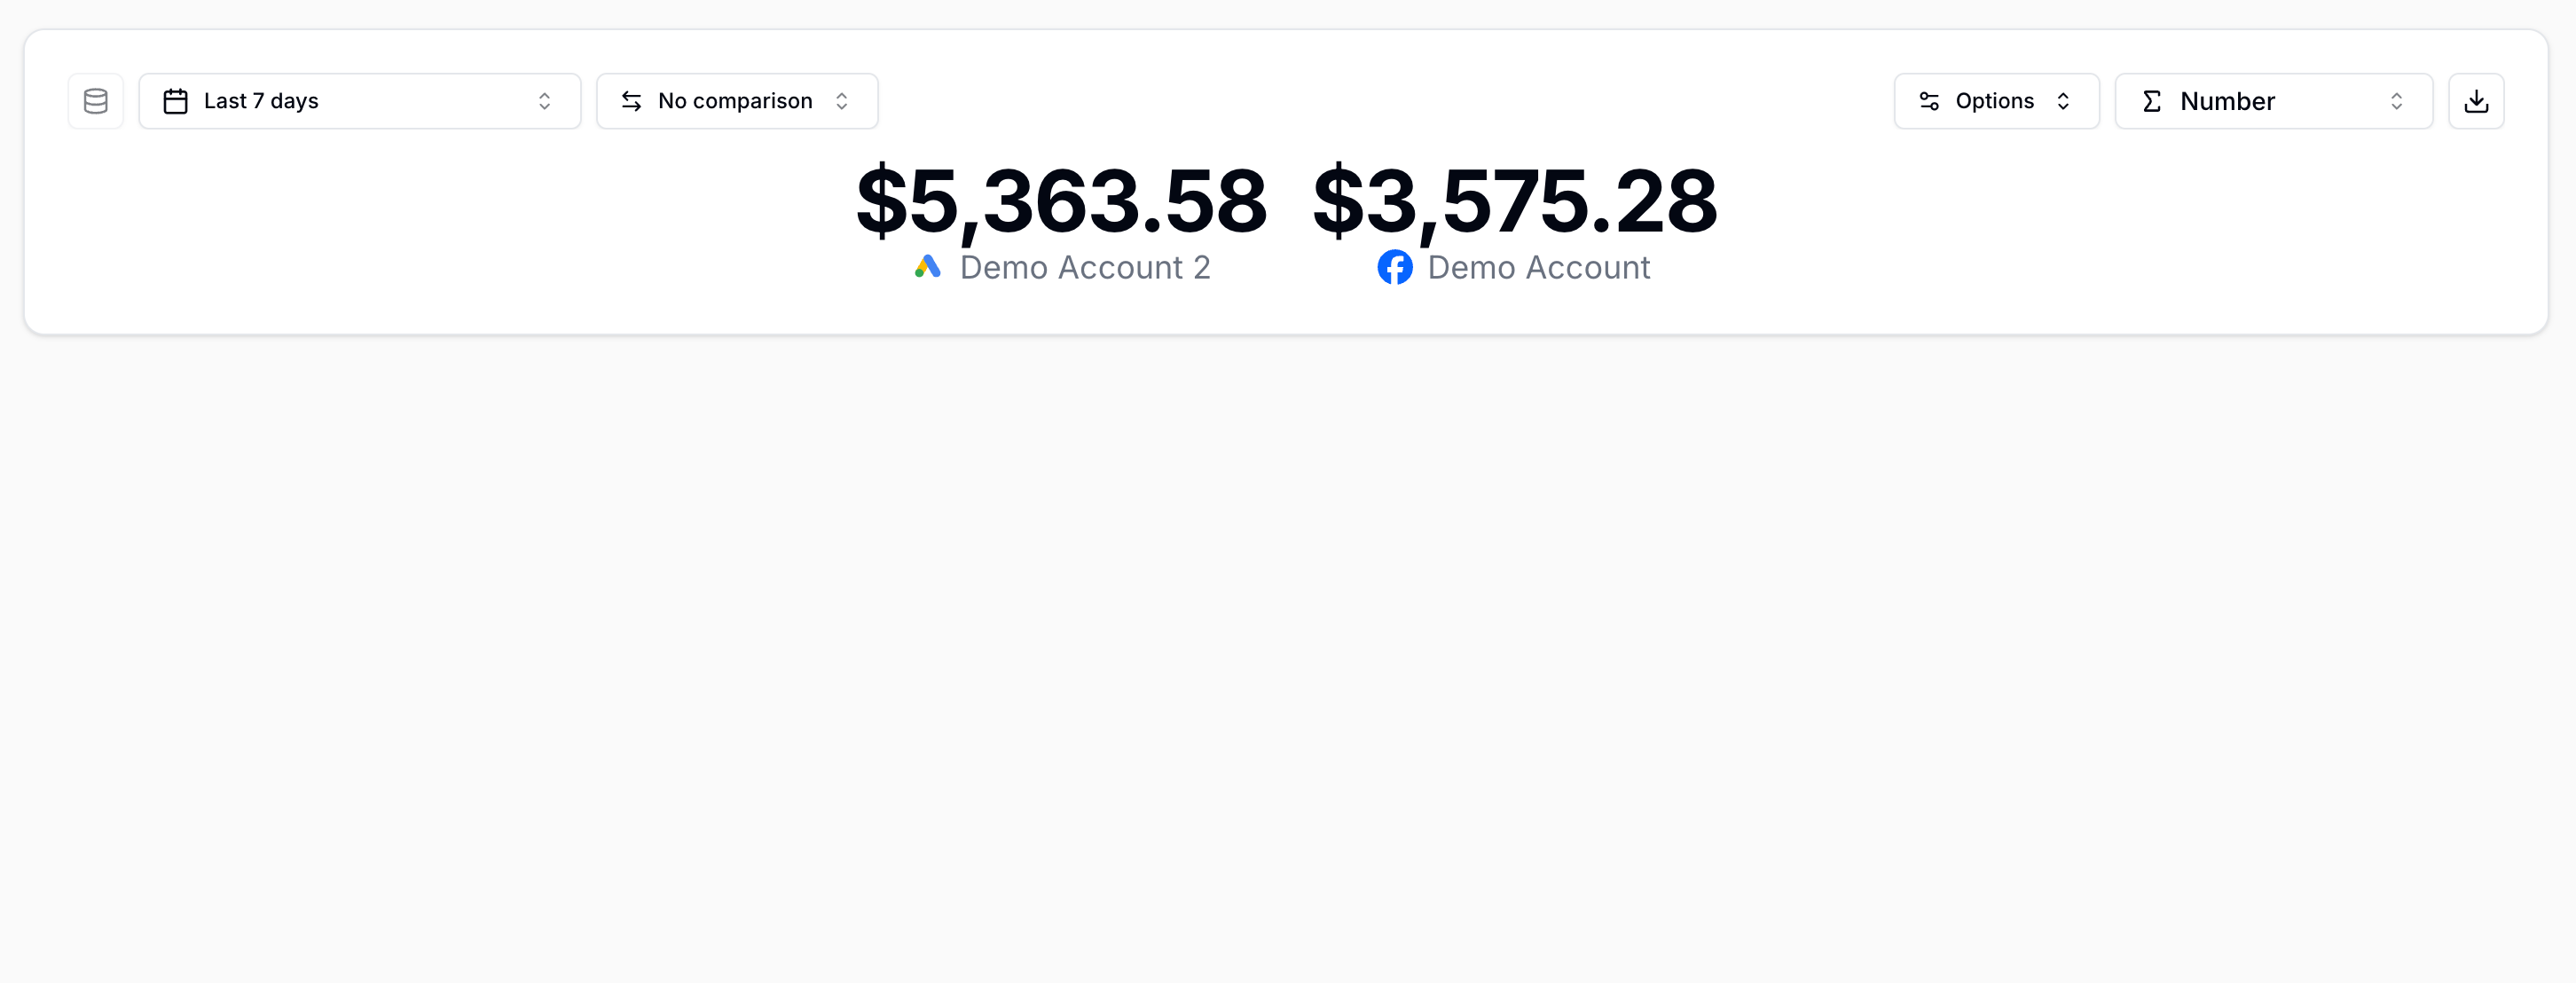 Total | 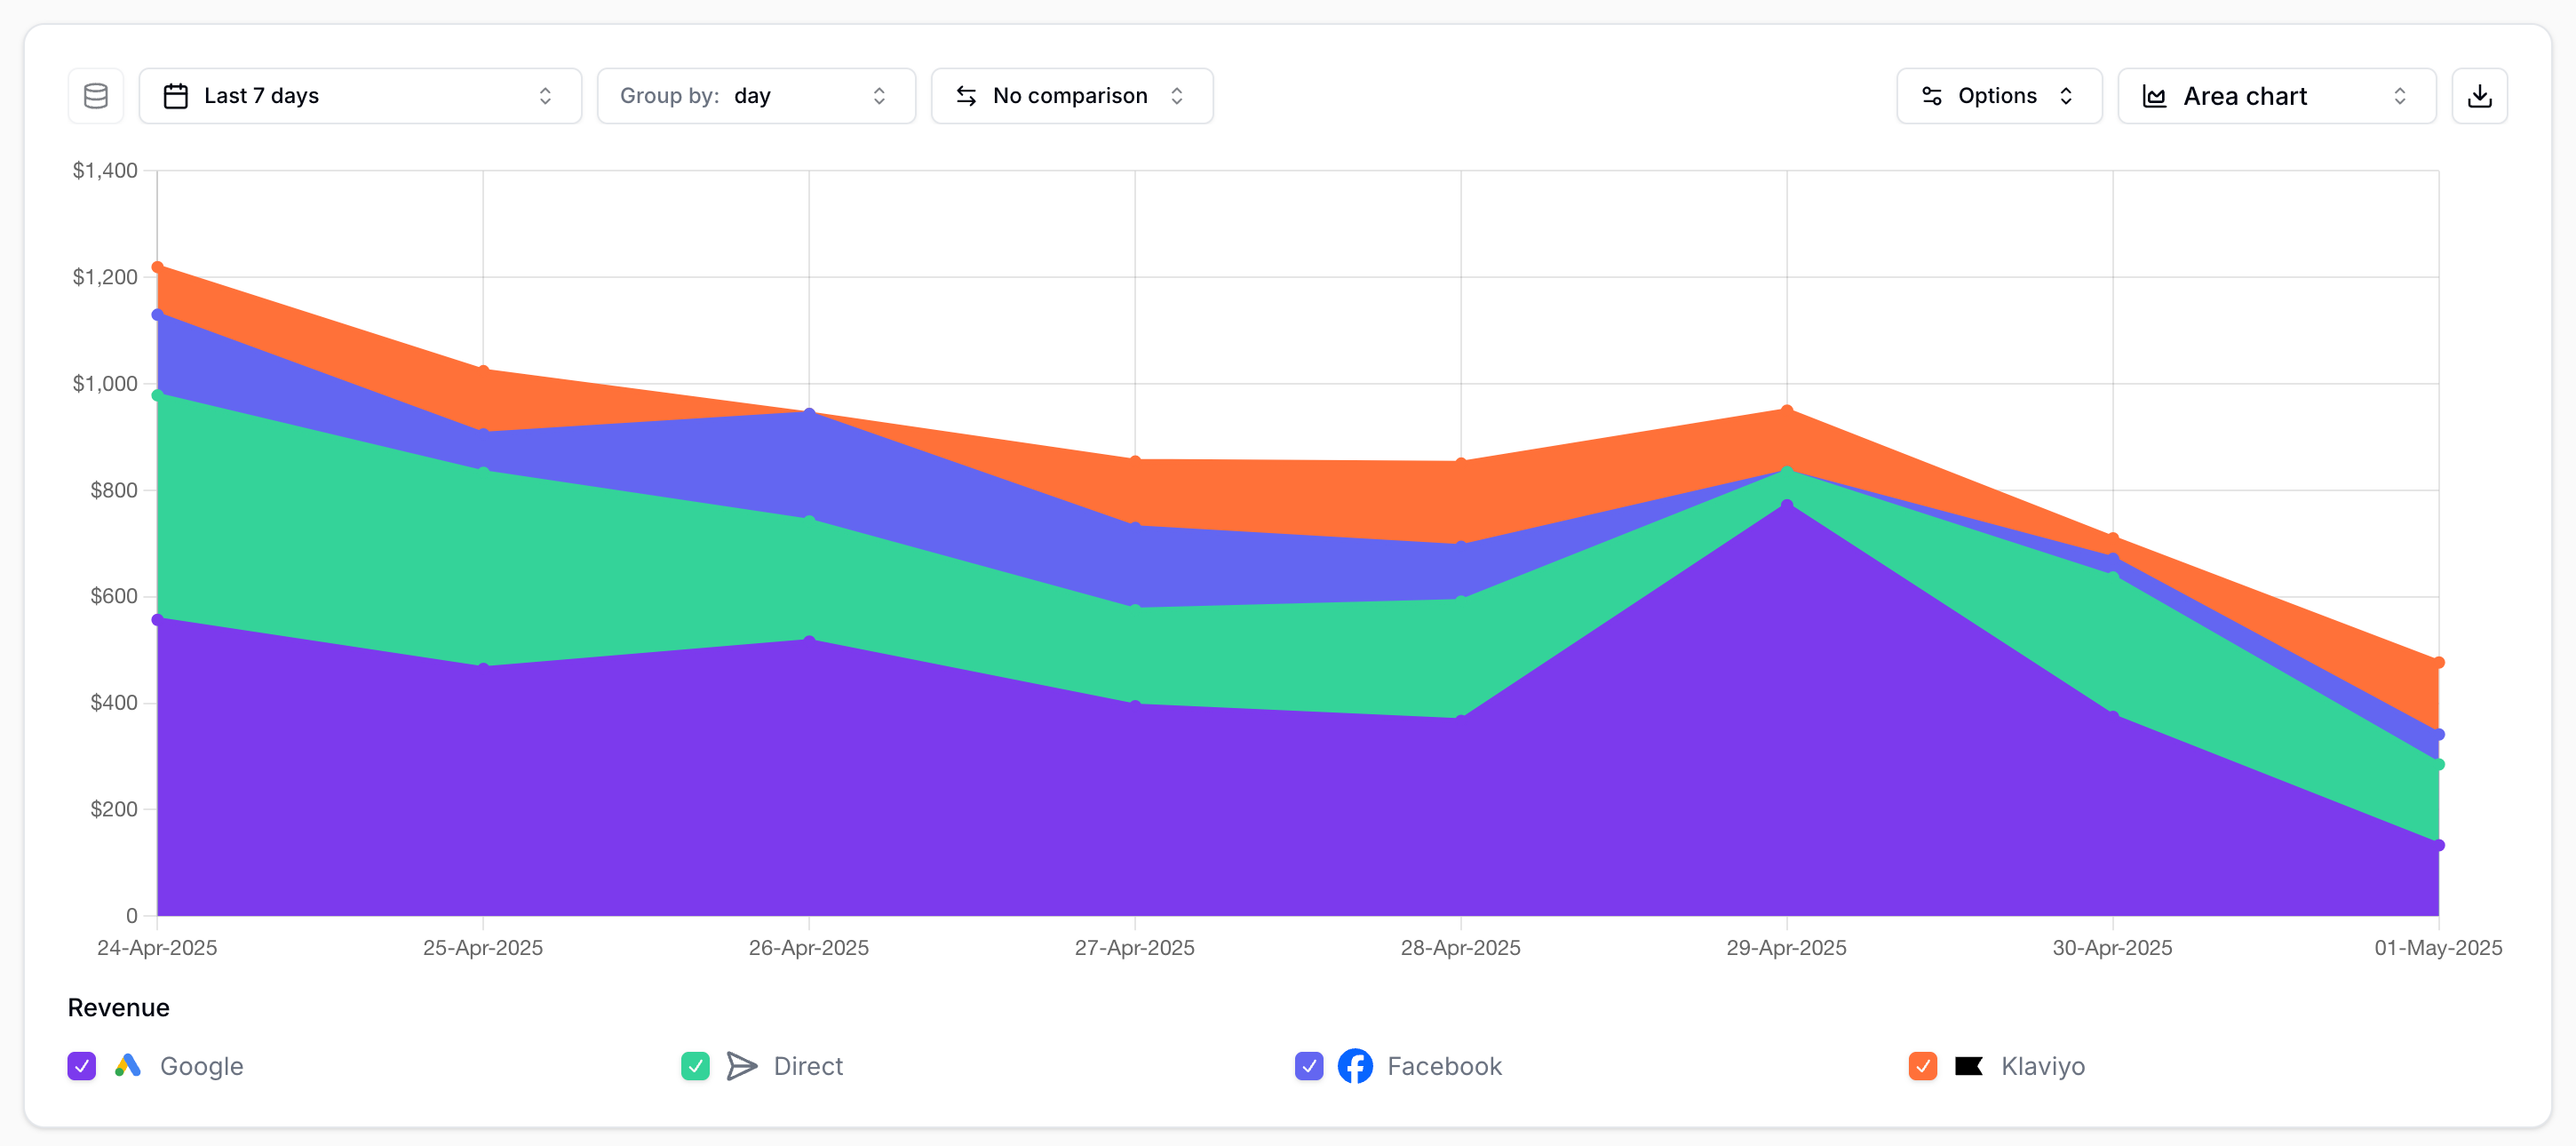 Area chart Insight |
Dashboards
Dashboards are custom overviews where you can view multiple Insights side-by-side. You can rearrange the layout to make dashboards easy to read.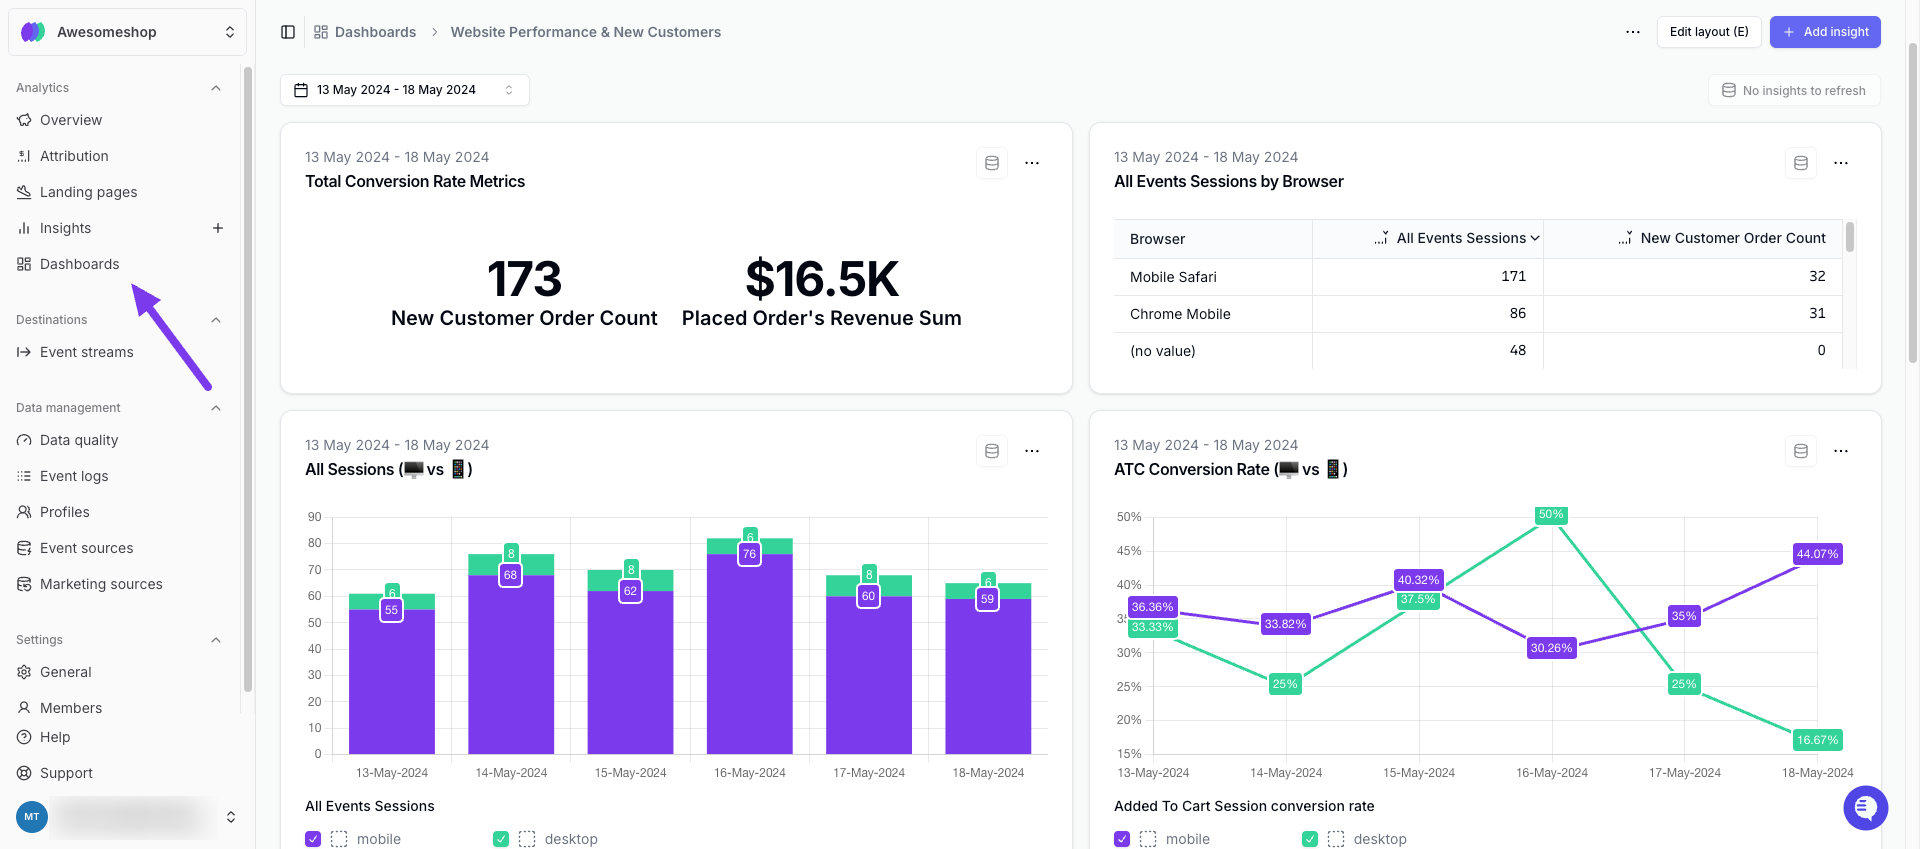
Example Dashboard