Products Report
Where to find the Products Report
You can access the Products Report by clicking on in the Analytics section, or by navigating directly to the . Check the to understand the precise definition of all product metrics.
Understanding the Products Report
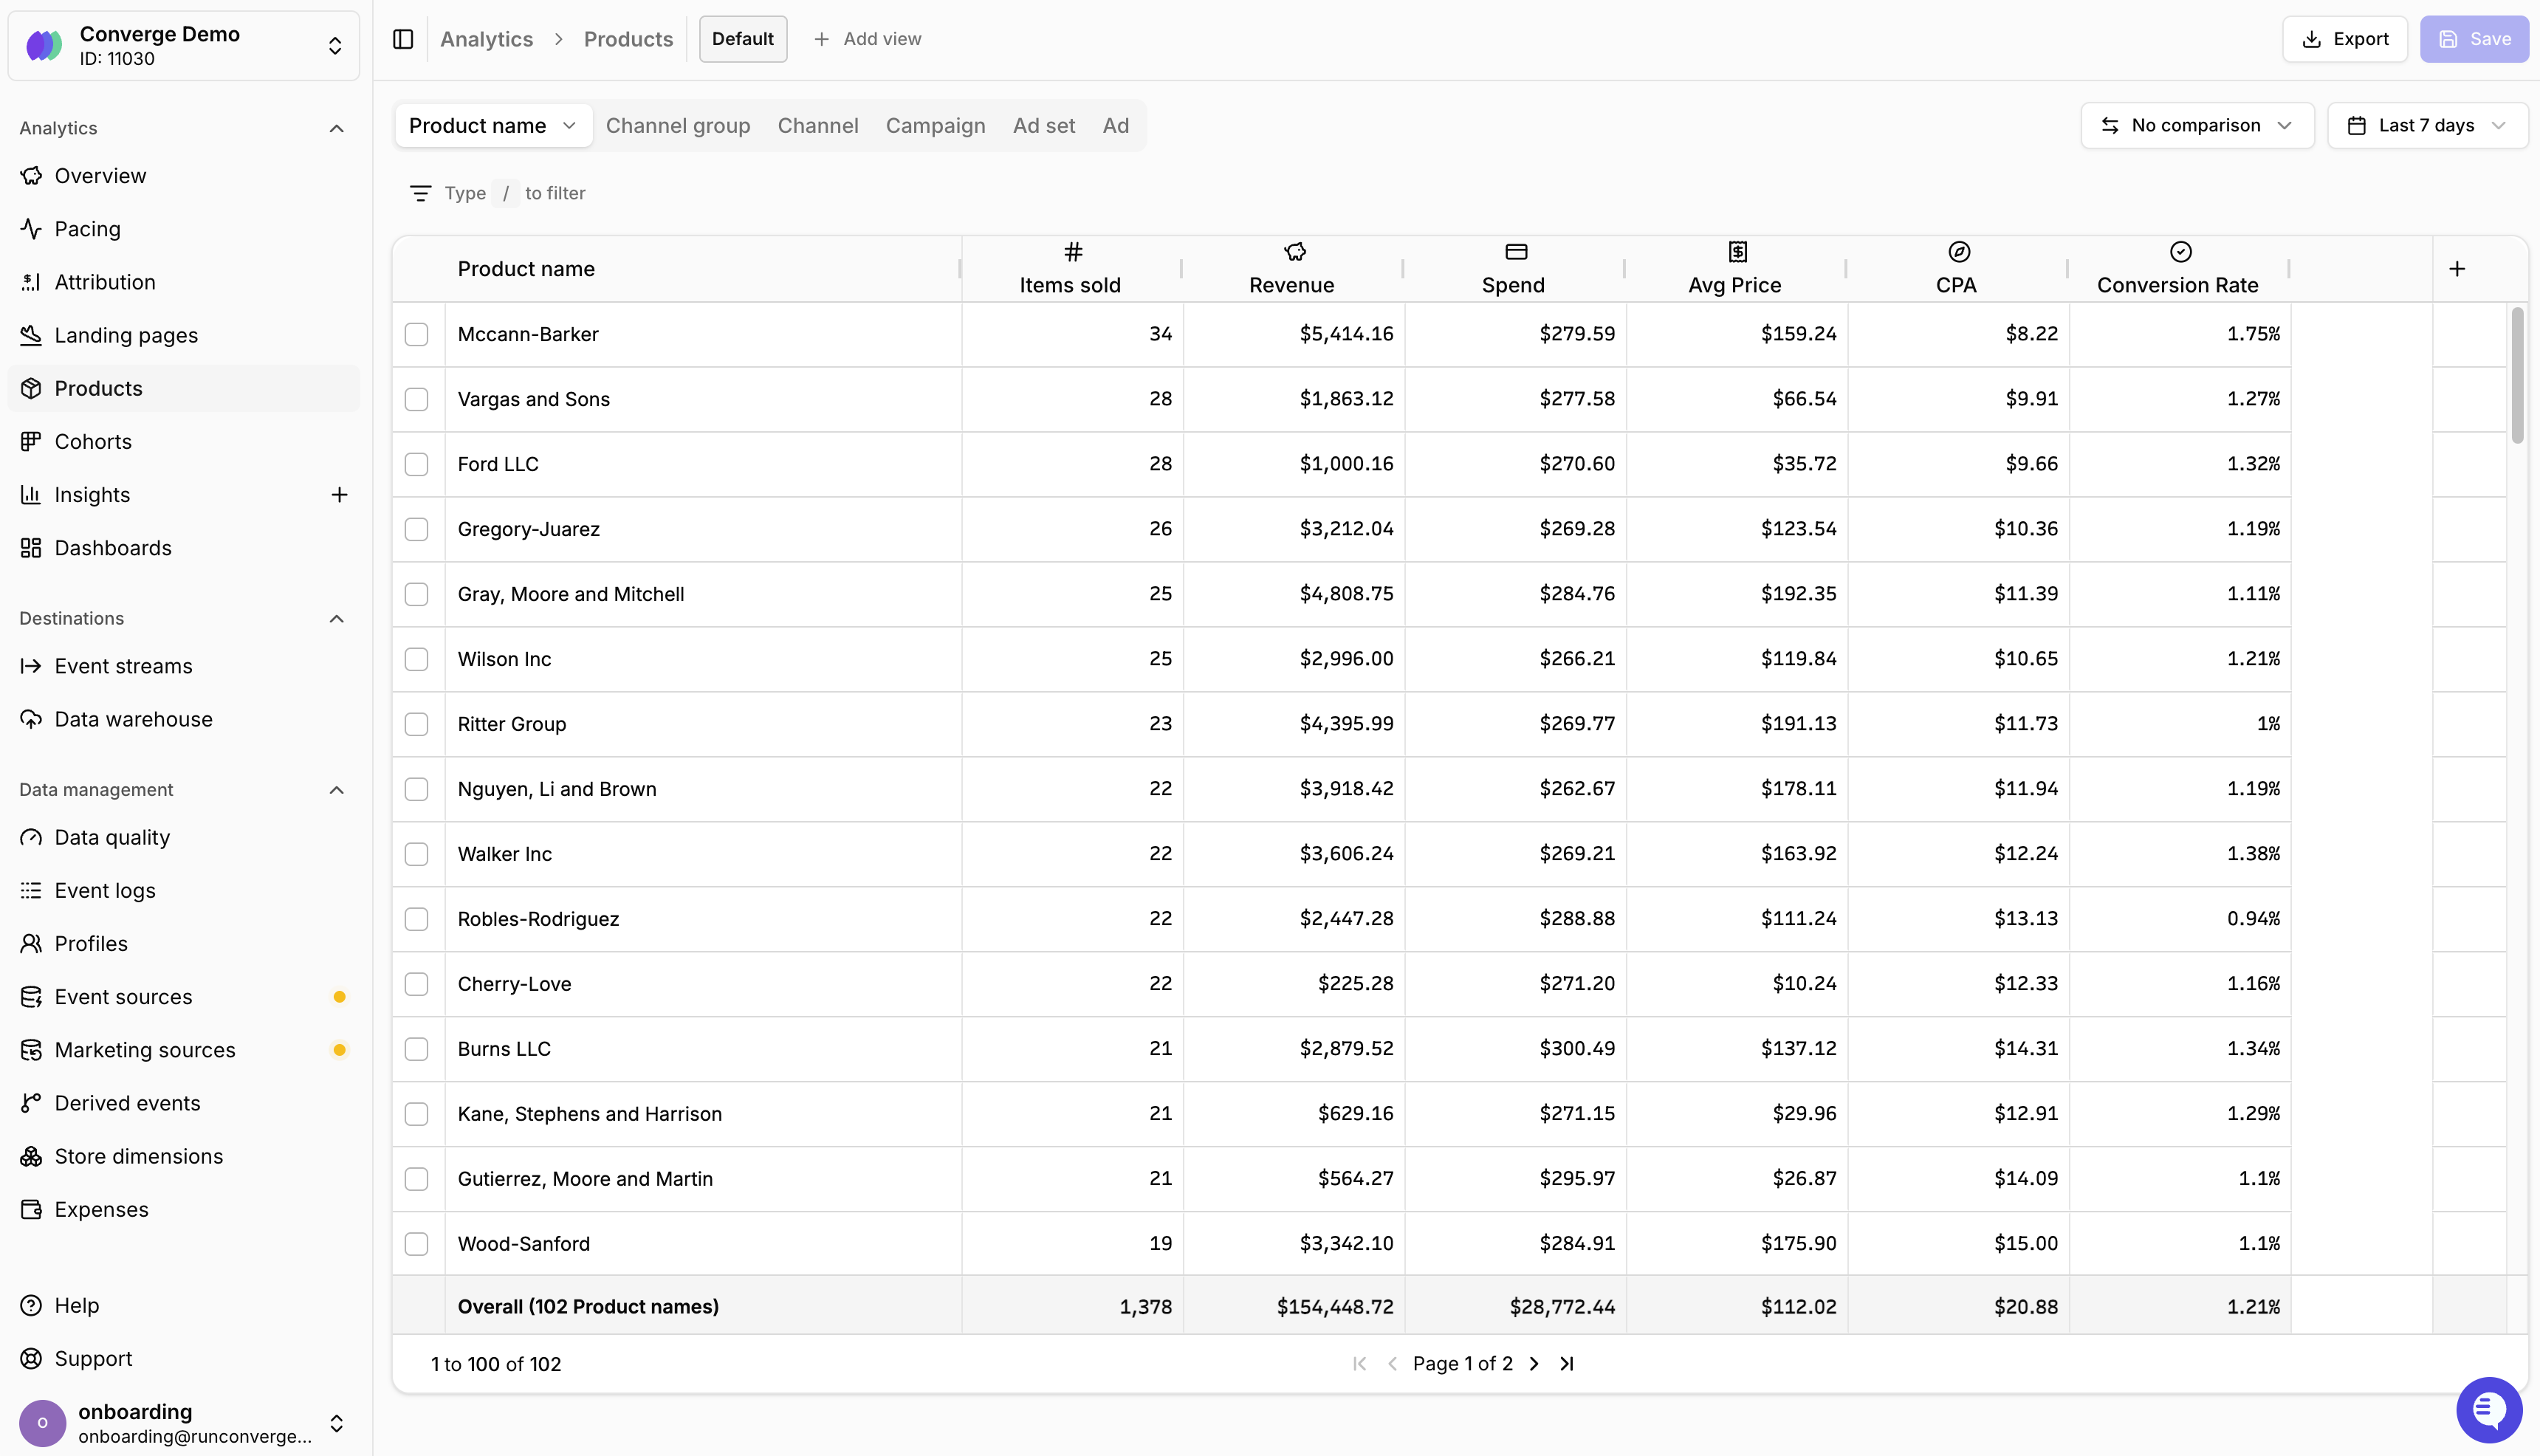
The Products Report gives you a per-product breakdown of your store’s performance. Each row represents a product, so you can quickly see which items drive revenue, which ones get added to cart most often, and which are actually profitable after accounting for costs. Your product data is displayed in a table format where:- Rows represent individual products (by default grouped by product name)
- Columns represent metrics (e.g., Items sold, Revenue, Added to Cart, COGS)
- Totals row at the bottom shows totals or averages across all products
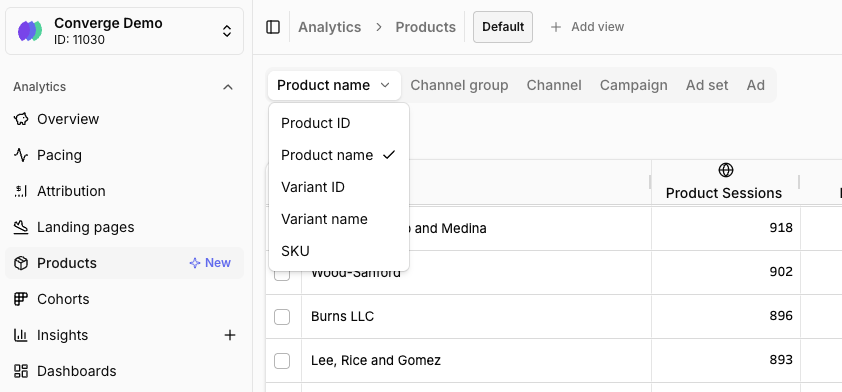
Products Breakdown ID
Key metrics
The Products Report includes metrics across several categories:- Sales metrics: Items sold, Total Revenue, Net Revenue, Avg Price
- Funnel metrics: Product Sessions, Product Views, Added to Cart, Started Checkout, Conversion Rate
- Cost & profitability metrics: COGS, Gross Profit, POAS (Profit on Ad Spend)
- Advertising metrics: Ad spend, ROAS, ACOS, CPA
Profitability metrics
The Products Report includes profitability columns like COGS, Gross Profit, and POAS (Profit on Ad Spend), giving you insight into the gross margin and profit profile of each product. POAS is especially useful as an alternative to ROAS — instead of measuring revenue per dollar of ad spend, it measures profit per dollar of ad spend. This gives you a much clearer picture of which products are actually worth advertising. See the Metrics Dictionary for all available profitability metrics.Ad spend allocation
Ad spend is allocated proportionally to products based on a product event from paid sessions. By default, Converge uses “Viewed Product” events, but you can configure this to any product event (e.g., “Added to Cart” or “Started Checkout”) in your Settings.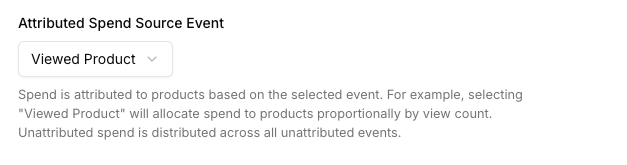
Configure the product event used for spend allocation
Common workflows
There are two common ways to use the Products Report with filters:- Start from a product, find the best campaigns. Filter the report to a specific product and then break down by campaign or ad. This shows you which campaigns and ads are converting best for that product — so you can double down on what’s working.
- Start from a campaign, see which products convert. Filter by a specific campaign or ad and see how spend is distributed across products. This helps you understand which products a campaign is actually selling and whether the product mix aligns with your goals.
Customizing the Products Report
You can customize which metrics appear, adjust the date range, and sort by any column to find your best (or worst) performing products.Add a metric
Add a metric
- Click the button in the rightmost column of the table
- Select a metric from the product metrics list
- The new column appears in your table immediately
Remove a metric
Remove a metric
- Hover over the metric column header you want to remove
- Click the menu icon that appears
- Select Remove from the dropdown menu
Re-order columns
Re-order columns
- Click and hold on a metric column header
- Drag it to the desired position
- Release to drop the column in its new position
FAQ
How is ad spend allocated to products?
How is ad spend allocated to products?
Product spend is calculated based on “Viewed Product” events from paid sessions. Converge attributes a share of ad spend to each product proportional to the product views it received from paid traffic.
Why are my profitability metrics missing or inaccurate?
Why are my profitability metrics missing or inaccurate?
Profitability metrics (COGS, Gross Profit, POAS) rely on cost data. If you haven’t configured your product costs, Converge either estimates them using a fallback gross margin or can’t calculate them at all.To fix this, go to Data Management > Expenses and set your product costs. You can set individual costs per SKU or configure a fallback gross margin as a starting point.
What's the difference between ROAS and POAS?
What's the difference between ROAS and POAS?
- ROAS (Return on Ad Spend) = Revenue / Ad Spend
- POAS (Profit on Ad Spend) = Gross Profit / Ad Spend
How is the Products Report different from the Attribution Report?
How is the Products Report different from the Attribution Report?
The Attribution Report shows performance by channel, campaign, ad set, or ad. The Products Report shows performance by individual product, making it ideal for:
- Identifying your most (and least) profitable products
- Understanding which products drive the most ad-attributed revenue
- Optimizing your product catalog based on real cost and profit data
- Spotting products with high traffic but low conversion